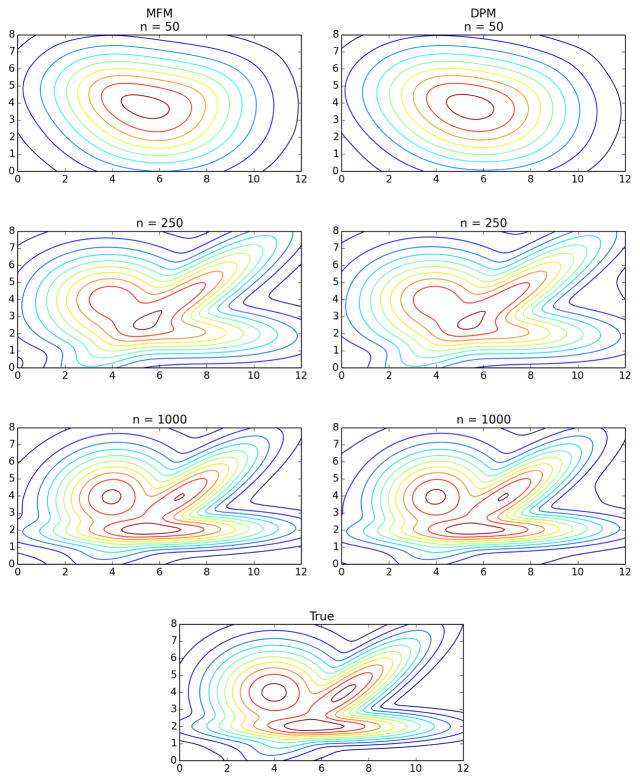
Figure 5.
Left: Hellinger distance between the estimated and true densities, for MFM (red, left) and DPM (blue, right) density estimates, on the bivariate example. Right: Bayes factors in favor of the MFM over the DPM. For each n ∈ {50, 100, 250, 1000, 2500}, five independent datasets of size n were used, and the lines connect the averages for each n.

