
Fig. 3. Spectroscopic characterization of as-grown GDY film.
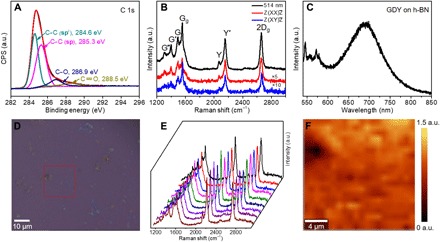
(A) High-resolution core-level XPS spectrum of C 1s. CPS, counts per second; a.u., arbitrary units. (B) Typical Raman spectrum (black) of GDY grown on graphene transferred to SiO2/Si substrate and polarization-dependent Raman spectra of GDY measured in XX (red) and XY (blue) polarization configurations by fixing the incident light and the scattered signal’s polarization directions in the parallel-polarized configuration and cross-polarized configuration (excitation at 514.5 nm). (C) PL spectrum of as-grown GDY on h-BN. (D) OM image of as-grown GDY on graphene with a mark indicating the mapping region. (E) Typical Raman spectra randomly collected across the corresponding sample in (D). (F) Integrated intensity ratio Raman maps of Y band (2189.2 cm−1) and 2D band (2696.5 cm−1) over the marked area in (D), confirming the uniformity of the GDY on the graphene surface in macroscopic scales.