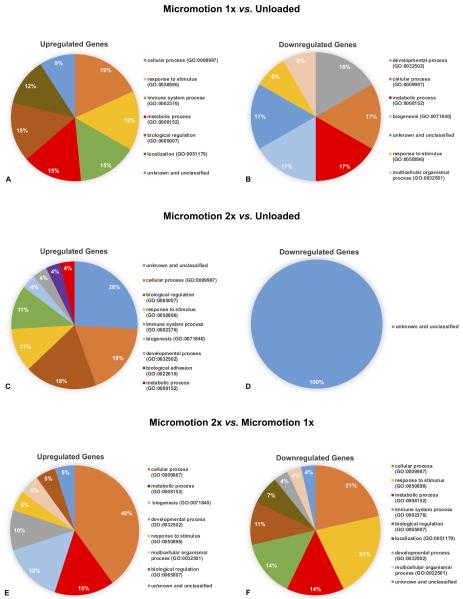
Fig. 6.
Pie charts presenting the percentage distribution of biological process ontologies identified for statistically significant genes (p < 0.05) differentially upregulated (A, C, E) and downregulated (B, D, F) between Micromotion 1× group vs. Unloaded group (A, B), Micromotion 2× group vs. Unloaded group (C, D), Micromotion 2× group vs. Micromotion 1× group (E, F) at day 7 post-surgery.

