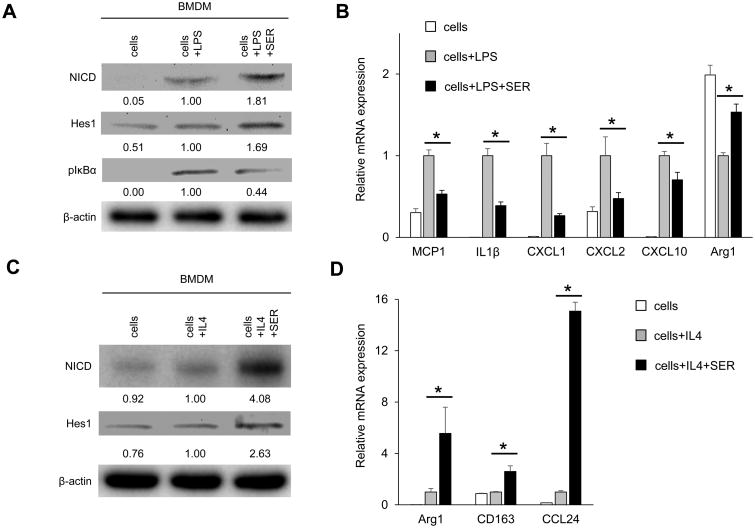
Figure 3. SER inhibits pro-inflammatory but enhances anti-inflammatory signature and up-regulates Notch1 signaling in BMDM cultures.
(A/B) BMDM stimulated with LPS (100ng/ml, 6h) were pretreated with or without SER (5μg/ml, 24h). (A) Western blot-assisted detection of NICD, Hes1 and pIκBα (Ser32). β-actin expression serves as an internal control for normalization. The values under the bands represent the relative ratio of normalized intensity compared to cells + LPS. Representative of three experiments is shown. (B) Quantitative RT-PCR-assisted detection of mRNA coding for MCP1, IL1β, CXCL1, CXCL2, CXCL10 and Arg1. Data were normalized to β2M gene expression (n=4/group). (C/D) BMDM stimulated with IL4 (10ng/ml, 24h) were pretreated with or without SER (5μg/ml, 24h). (C) Western blot-assisted detection of NICD and Hes1. β-actin expression served as an internal control for normalization. The values under the bands represent the relative ratio of normalized intensity compared to cells + IL4. Representative of three experiments is shown. (D) Quantitative RT-PCR-assisted detection of mRNA coding for Arg1, CD163 and CCL24. Data were normalized to β2M gene expression (n=4/group). Data are shown as mean±SD (*p<0.05, Student t-test).

