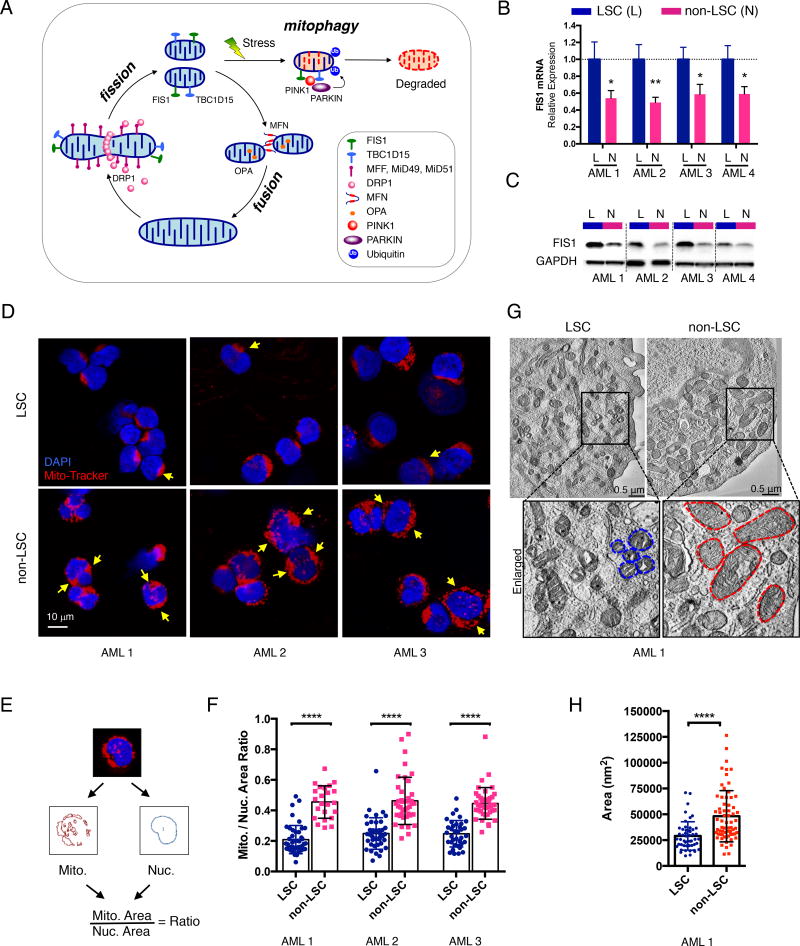
Figure 1. AML LSCs have higher expression of FIS1 and distinct mitochondrial morphology.
(A) A diagram showing regulation of healthy mitochondrial network through mito-fusion, mito-fission and mitophagy.
(B) qPCR results showing relative expression of FIS1 gene in sorted ROS-low LSCs (L) versus ROS-high non-LSCs (N). Mean ± SD (n=3). Type 2, two-tailed t-test.
(C) WB results showing expression of FIS1 protein in sorted ROS-low LSCs (L) versus ROS-high non-LSCs (N).
(D) Representative confocal images showing morphology of mitochondria in ROS-low LSCs versus ROS-high non-LSCs. Yellow arrows highlight distinct mitochondrial morphology.
(E) A diagram showing the method used to quantify the mitochondrial to nuclear area ratio.
(F) Mitochondrial to nuclear area ratio in LSCs vs. non-LSCs in 3 primary AML specimens. Each dot represents an individual cell. Mean ± SD. Type 3, two-tailed t-test.
(G) Representative TEM images showing morphology of mitochondria in ROS-low LSCs and ROS-high non-LSCs. Blue and red dotted lines outline mitochondrial shape.
(H) Quantification of mitochondrial cross-section area from the TEM images of AML 1. Each dot represents a single mitochondrion. Mean ± SD. Type 3, two-tailed t-test.
See also Figure S1.

