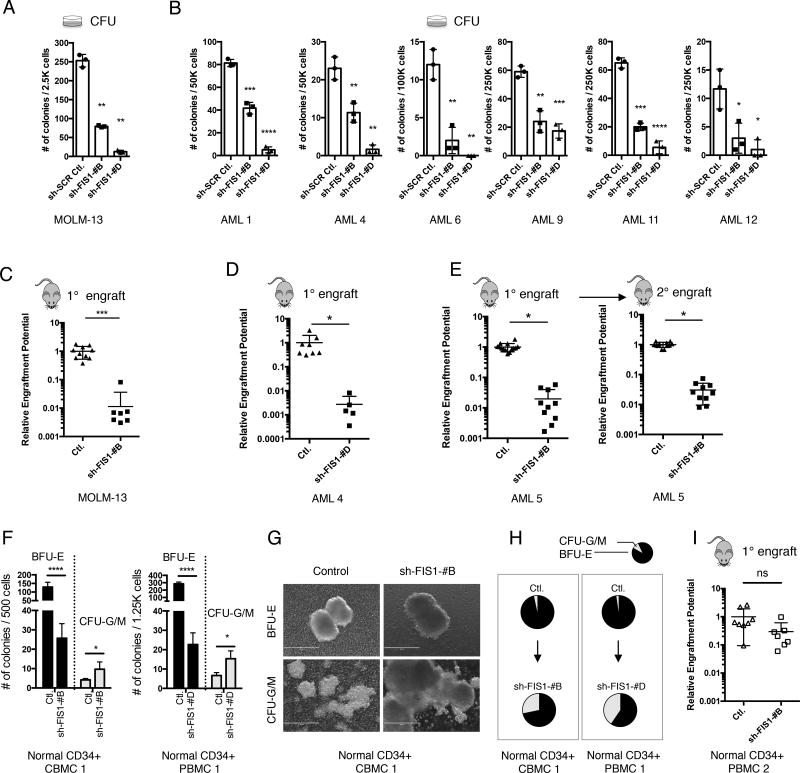
Fig. 3. Depletion of FIS1 impairs stem and progenitor potential of primary AML but relatively spares normal HSPCs.
(A) Colony-forming ability of MOLM-13 cells following shRNA-mediated knock-down of FIS1. Mean ± SD (n=3). Type 2, two-tailed t-test.
(B) Colony-forming ability of primary AML cells following shRNA-mediated knock-down of FIS1. Mean ± SD (n=3). Type 2, two-tailed t-test.
(C) Normalized relative engraftment potential of MOLM-13 cells with or without FIS1 knock-down.
(D) Normalized relative engraftment potential of primary AML.
(E) Normalized relative engraftment potential of primary AML 5 with or without FIS1 knock-down. 1° and 2° indicate primary and secondar y xenograft experiments, respectively.
(F) Number of BFU-E and CFU-G/M colonies produced by normal CD34+ CBMCs/PBMCs in methylcellulose. Mean ± SD, (n=3). Type 2, two-tailed t-test.
(G) Representative images showing morphology of BFU-E and CFU-G/M colonies.
(H) Pie charts showing changes in proportion of CFU-G/M and BFU-E colonies induced by FIS1 knock-down.
(I) Normalized relative engraftment potential of normal CD34+ PBMCs with or without FIS1 knock-down.
In C, D, E, and I, each dot represents an individual mouse and lines represent mean ± SD. Type 2, two-tailed t-test.
See also Figure S3.

