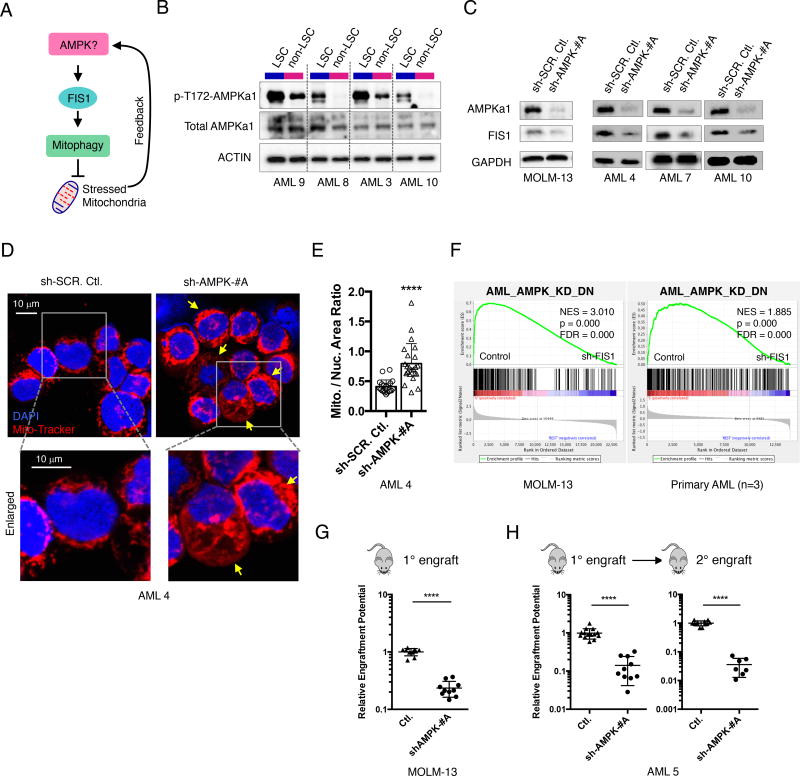
Figure 6. Inhibition of AMPK signaling upstream of FIS1 depletes the LSC potential of primary AML.
(A) A diagram showing the rationale underlying AMPK hypothesis.
(B) WB images showing expression of p-T172-AMPKa1 and total AMPKa1 in ROS-low LSCs (L) versus ROS-high non-LSCs (N).
(C) WB images showing expression of FIS1 in MOLM-13 and primary AML cells at day 6 following AMPKa1(PRKAA1) knock-down.
(D) Representative confocal images showing mitochondrial morphology of primary AML cells at day 6 following shRNA-mediated knock down of AMPKa1. Arrows highlight mitochondrial accumulation.
(E) Mitochondrial to nuclear area ratio in control and shAMPK AML cells. Each dot represents a single cell. Mean + SD. Type 3, two-tailed t-test.
(F) GSEA enrichment plots showing loss of FIS1 in MOLM-13 (3 technical replicates) and primary AML cells (3 biological replicates) result in down-regulation of the AML_AMPK_KD_DN gene set. “sh-FIS1” represents the sh-FIS1-#B and sh-FIS1-#D together.
(G) Normalized relative engraftment potential of MOLM-13 cells with or without AMPK knock-down.
(H) Normalized relative engraftment potential of primary AML 5 with or without AMPK knock-down. 1° and 2° indicate primary and secondar y xenograft experiments, respectively.
In G and H, each dot represents an individual mouse and lines represent mean ± SD. Type 2, two-tailed t-test.
See also Figure S6.

