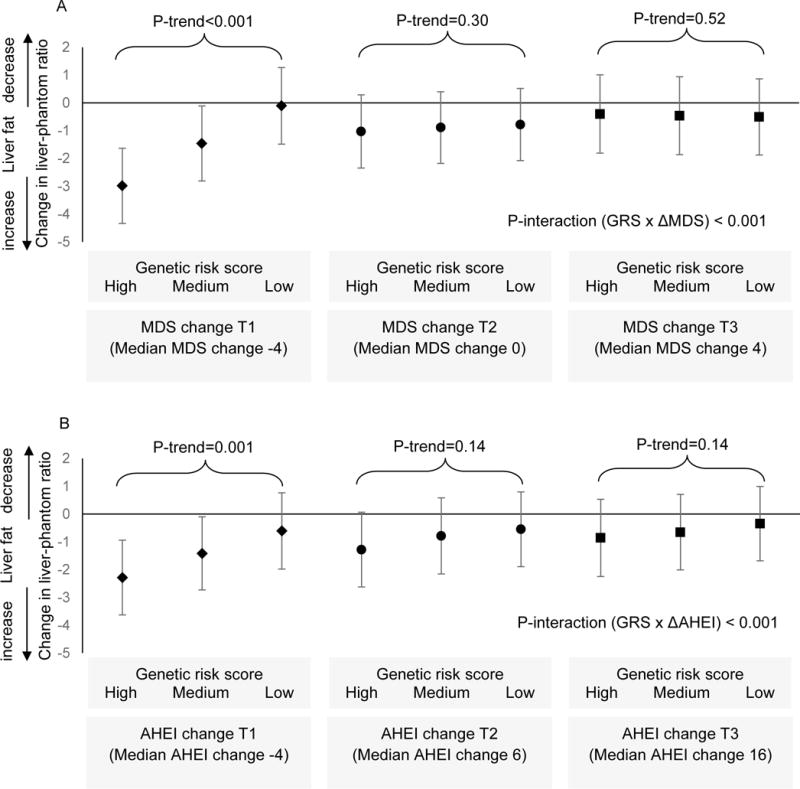
Figure 3.

Association between genetic risk score (GRS; tertile categories) and change in liver-phantom ratio across tertile categories of dietary score change. A is for Mediterranean-style dietary score (MDS) and B is for alternative healthy eating index (AHEI). Values of y-axis are mean change and 95% confidence interval in liver-phantom ratio (a lower value represent increase in liver fat accumulation). P-interaction and P-trend were calculated with adjustment for sex, age, and baseline values of liver-phantom ratio, dietary score (MDS or AHEI), aspartate aminotransferase (AST)/alanine aminotransferase (ALT) ratio, smoking status, physical activity level, energy intake, BMI, as well as change in smoking status, physical activity, and energy intake.
