
Figure 2.
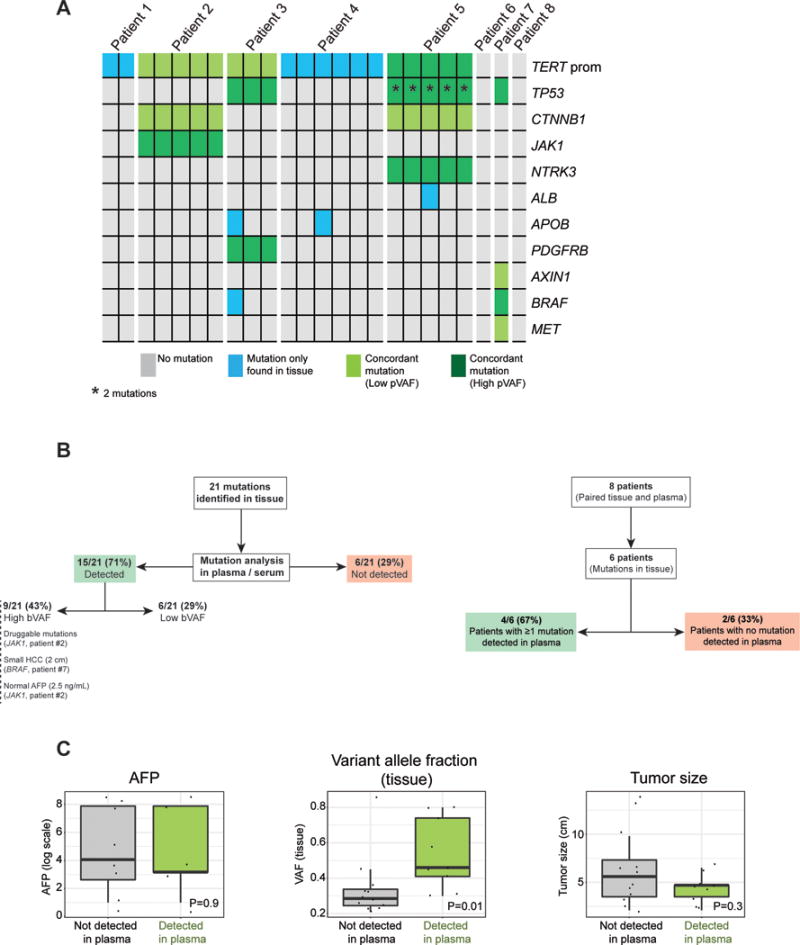
a) Heat-map of detected mutations with their concordance in tissue and plasma. Each column represents one tumor region and each row is a mutated gene found in tissue.
b) Performance of ultra-deep sequencing to detect plasma mutations, on a mutation-basis and on a patient-basis.
c) Impact of tumor size, AFP levels and variant allele fraction of the mutation in tissue in detection rate of cfDNA.