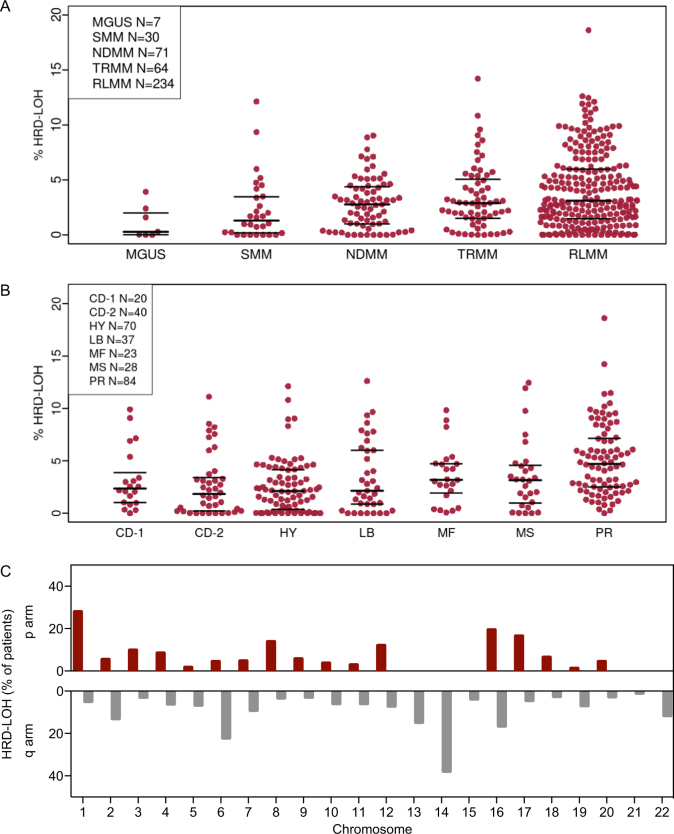
Fig. 1.
a Percentage of genomic HRD-LOH by disease stage. b Percentage of genomic HRD-LOH by UAMS molecular subgroup. The raw data points and the median and inter-quartile range for each data set are shown. c Distribution of HRD-LOH shown as the percentage of patients with HRD-LOH >1% at each genomic locus across the autosomal chromosomes. For the acrocentric chromosomes, 13, 14, 15, 21, and 22, only the q arm was considered as estimates of HRD-LOH in the p arm would be unreliable

