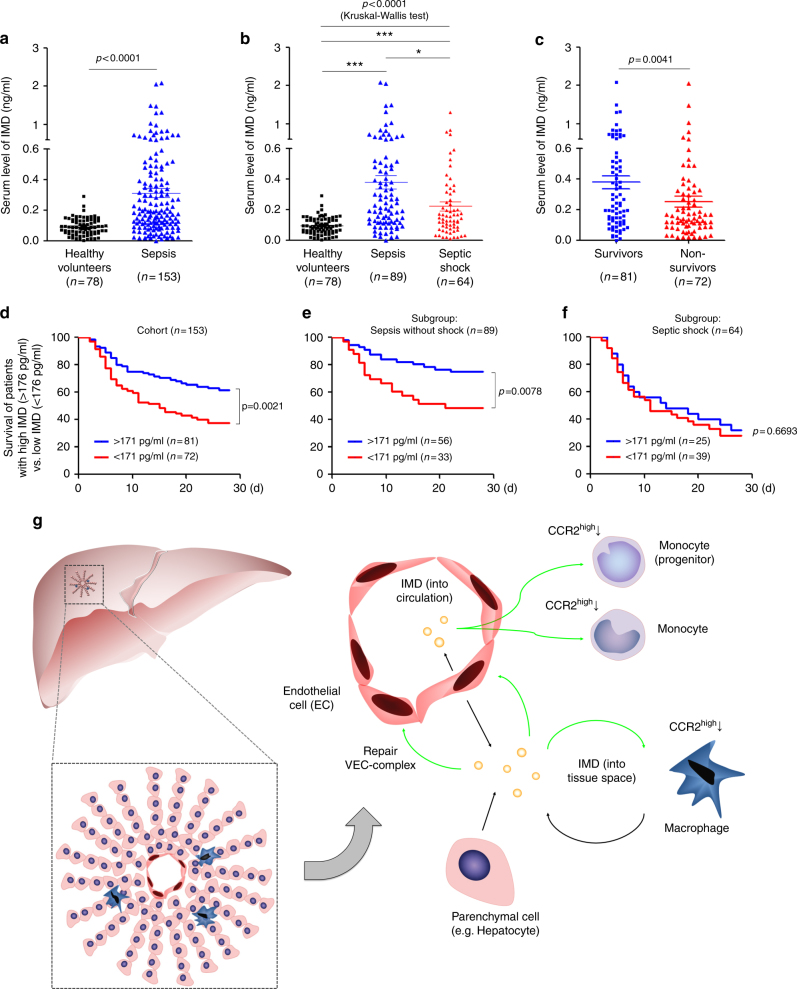
Fig. 8.
IMD level indicates survival outcome in septic patients. a The IMD levels in healthy volunteers and in patients with sepsis were presented as scatter plots with mean ± SEM. b The IMD levels in healthy volunteers and in septic patients with or without shock. c The IMD levels in the survived and non-survived sepsis patients. d–f Kaplan–Meier survival analysis of all patients with sepsis (d), sepsis without shock (e), and septic shock (f) with IMD levels ≥ 171 pg/ml (the median) versus those <171 pg/ml. Significance was assessed by Mann–Whitney test (a, c), Kruskal–Wallis test followed by non-parametric Dunn’s post-hoc analysis (b), and log rank test (d–f). g The sources of IMD and its induction in response to sepsis: the circulating IMD in the blood is mainly from the endothelial cells and functions like an endocrine factor. Meanwhile, the parenchymal cells (such as hepatocytes) and infiltrated monocytes/macrophages are the two main sources of IMD in organ tissues, functioning in a paracrine/autocrine manner. During sepsis, the bacterial endotoxin or the widespread hypoxia triggers the transcription of IMD, which in turn repairs the VEC complex through a Rab11-dependent pathway and reduces the secretion of inflammatory factors by downregulating the CCR2high monocytes and macrophages, resulting in self-protective effect. Notably, the IMD peptides released from macrophage themselves can inhibit further infiltration of macrophages into the local tissue by downregulating CCR2, which may represent a feedback loop that maintains the immune balance that was previously disrupted in response to the severe infection

