Figure 2.
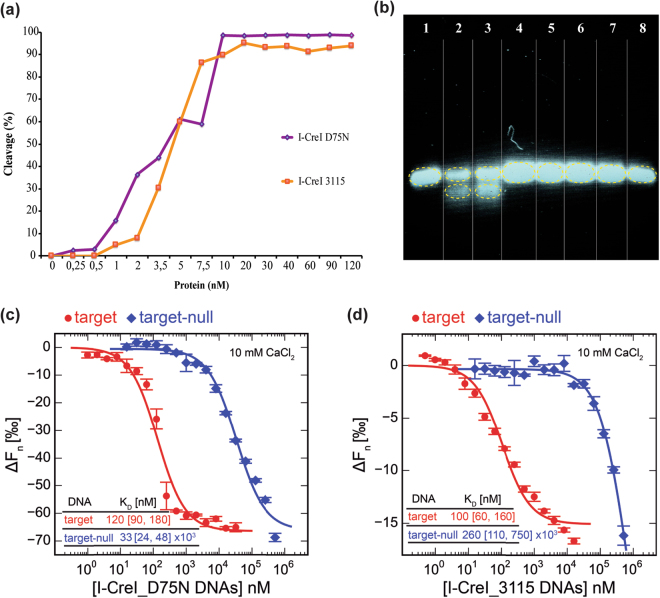
I-CreI in vitro cleavage and binding experiments. (a) In vitro cleavage titration analysis for I-CreI_D75N_target and I-CreI_3115_target using linearized plasmids containing the cleavable target sequences. (b) Validating 5NNN non-cleavable target patterns using labelled duplex DNA targets. Lanes: 1, I-CreI_D75N_target; 2, I-CreI_D75N_target in the presence of I-CreI_D75N protein; 3, I-CreI_3115_target in the presence of I-CreI_3115 protein; 4, I-CreI_3115_target; 5, I-CreI_D75N_target-null (non-cleavable derivative); 6, I-CreI_D75N_target-null in the presence of I-CreI_D75N protein; 7, I-CreI_3115_target-null (non-cleavable derivative) in the presence of I-CreI_3115 protein; 8, I-CreI_3115_target-null (non-cleavable derivative). (c) I-CreI_D75N/I-CreI_D75N_target or target-null binding by microscale thermophoresis (in the presence of 10 mM CaCl2). (d) I-CreI_3115/I-CreI_3115_target or target-null binding by microscale thermophoresis (in the presence of 10 mM CaCl2). The change in thermophoresis is plotted against the concentration of DNA in a logarithmic scale and fitted to a 1:1 binding model to yield the corresponding KDs. Numbers in brackets represent the 68.3% confidence interval calculated by ESP (error-surface projection).

