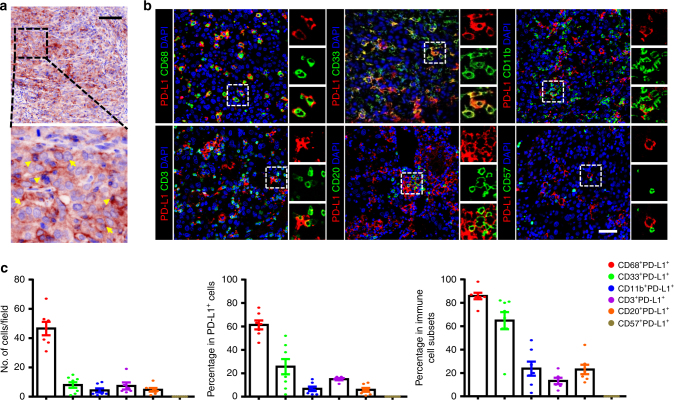
Fig. 1.
PD-L1 expression in HCC tumour tissues. a Representative image of PD-L1 (brown) by IHC-TSA staining in HCC tumour tissue. Arrows indicate representative PD-L1+ tumour cells, triangles indicate representative PD-L1+ immune-cell-like cells. Scale bar, 100 μm. b Multiplex immunofluorescence staining with the indicated immune cell markers in HCC tumour tissue. PD-L1 staining is shown in red; markers of immune cell markers in green; and DAPI staining in blue. Scale bar, 50 μm. c Analysis of the percentages of double-positive immune cells in total PD-L1+ cells (middle), counts of double-positive cells per field (left), and the percentage of double-positive immune cells within different immune cell subsets (right). Data are expressed as the mean ± SEM

