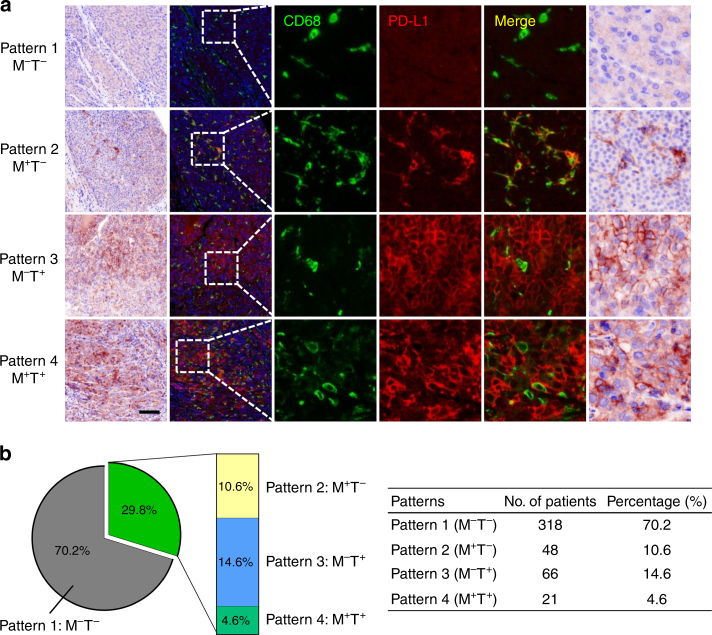
Fig. 2.
Different expression patterns of PD-L1 in HCC tumours. a Paraffin-embedded HCC tumour tissue sections with PD-L1 expression Pattern 1 (M–T–), Pattern 2 (M+T–), Pattern 3 (M–T+), and Pattern 4 (M+T+) were subjected to TSA-IHC using anti-human CD68 and anti-human PD-L1 antibodies. Images were obtained using the Vectra System and analysed by inForm image analysis software. Images presented in bright field are in the first column, with corresponding fluorescent images in the second column. Small-scale images are shown in the following columns. Scale bar, 100 μm. b Graphs showing the number of patients and the percentage of each pattern

