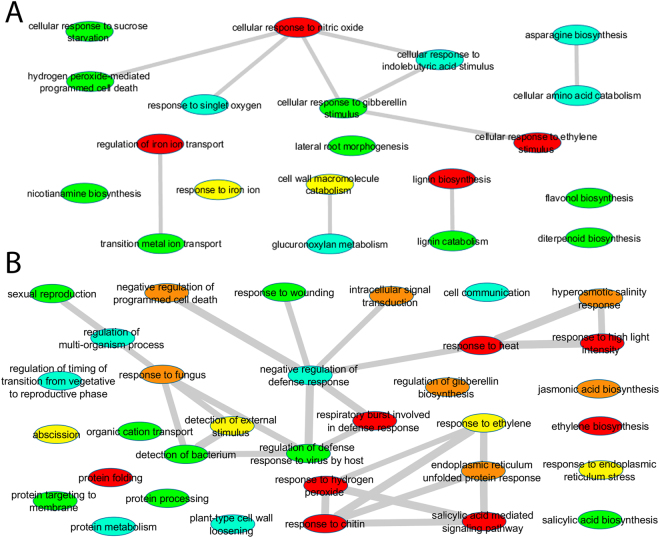
Figure 3.
Differentially expressed genes summarized as a tree network using REVIGO. (A) GO terms related to biological processes of upregulated genes in the comparison of control versus P. indica. (B) GO terms related to biological processes of downregulated genes in the comparison control versus P. indica. GO categories are represented by circles and are color coded according to corrected p-value for GO enrichment analysis. Red indicates categories that are significantly enriched at p < 0.05 while nonsignificant categories are color coded with corrected p < 0.5 = orange, p < 1 = yellow, p < 5 = green, and p < 10 = blue). Lines indicate connections between categories within the GO hierarchy and singletons have been grouped by similar function.

