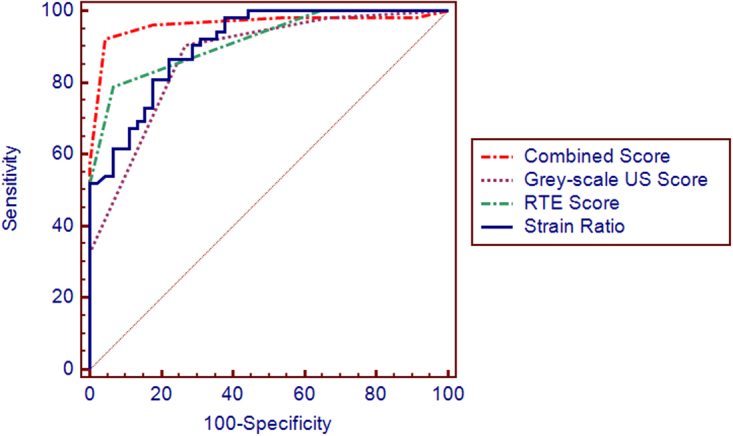
Figure 5.

ROC curves of gray scale ultrasound, RTE, combined evaluation, and SR. Areas under the ROC curve for gray-scale ultrasound, RTE, combined evaluation and SR were 0.871, 0.916, 0.963 and 0.906 respectively. The diagnostic power of the combined evaluation was better than that of gray-scale ultrasonography (Z = 3.604, P < 0.01) and RTE (Z = 2.008, P = 0.045). The diagnostic power of gray-scale ultrasound was not significantly different compared with that of RTE (Z = 1.162, P = 0.245). The combined evaluation had better diagnostic power than that of strain ratio, but there was no significant difference (Z = 1.642, P = 0.1006).
