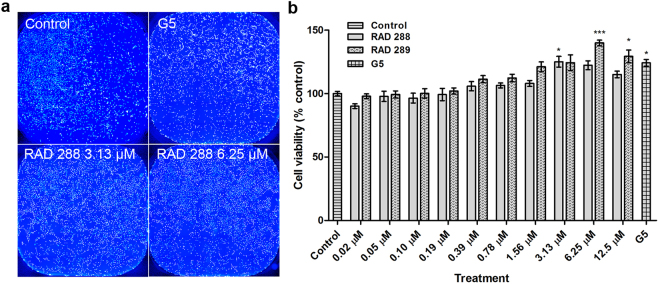
Figure 2.
Effects on metabolic activity and proliferation of mOECs after treatments with RAD288 and RAD289. (a) Representative images of mOECs after drug exposure. Nuclei were stained with Hoechst. Scale bar = 100 µm. (b) Cell viability of mOECs exposed to 0.2% dimethyl sulfoxide (control), 1% G5 Supplement, RAD288 (0.02–12.5 µM) and RAD289 (0.02–12.5 µM) using the resazurin metabolic activity indicator. Triplicate wells were used in three separate experiments, mean ± SEM. ***p < 0.001, *p < 0.05, Student’s t-test.

