Figure 4.
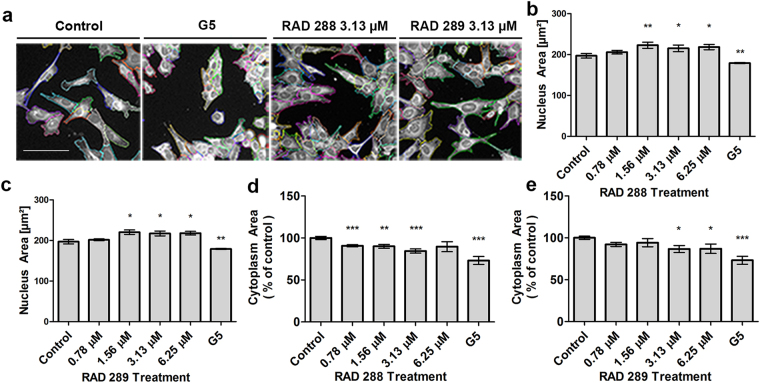
Effect of RAD288 and RAD289 on morphology of mOECs. (a) Representative images of mOECs after drug exposure. Images were segmented with Harmony software using Find Cytoplasm method. Scale bar = 100 µm. (b) Nucleus area of mOECs after treatment with several concentrations of RAD288. (c) Nucleus area of mOECs after treatment with a range of concentrations of RAD289. (d) Cytoplasm area of mOECs after treatment with several concentrations of RAD288. (e) Cytoplasm area of mOECs after treatment with a range of concentrations of RAD289. Negative control (0.2% DMSO) and positive control (1% G5 Supplement) were used. Triplicate wells were used in three separate experiments. Results represent the mean +/− SEM. ***p < 0.001, **p < 0.01, *p < 0.05, Student’s t-test.

