Figure 4.
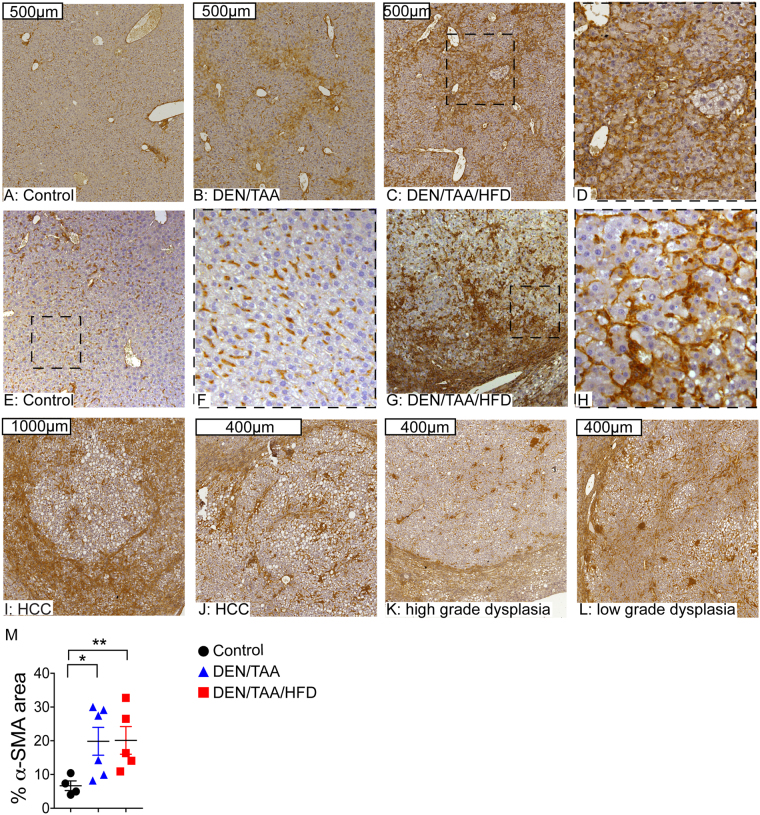
α-SMA immunohistochemistry in liver. (A–D) α-SMA immunostaining (brown) and haematoxylin counterstain in control (A), DEN/TAA (B) and DEN/TAA/HFD (C,D) treatment groups. (E–L) Examples of the α-SMA expression in different types of lesions observed in DEN/TAA/HFD treated mice. Boxes formed by black dashes indicate higher magnification of adjacent images. (M) Quantitation of α-SMA immunopositivity by area in the whole liver section. Representative data from 5–6 mice per group. Statistical analysis used Kruskal-Wallis test, *p < 0.05, **p < 0.01. Scale Bars = 400 μm (J–L), 500 μm (A–C), and 1000 μm (I).

