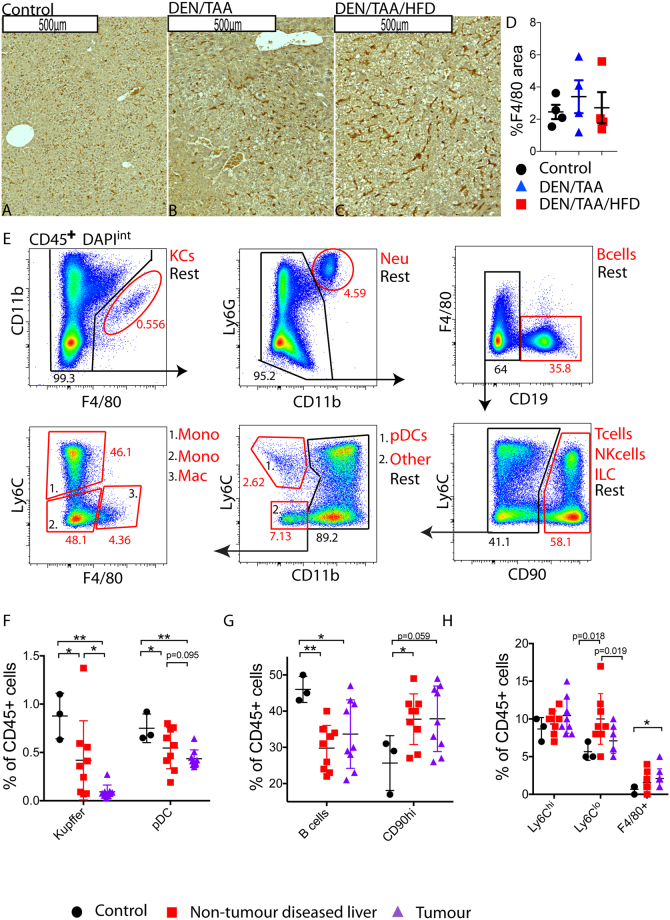
Figure 6.
Leukocyte infiltration into HCC in the DEN/TAA/HFD model. (A–C) F4/80 immunostaining (brown) of liver sections, n = 5–6. Scale Bars = 500 μm. (D) Quantitation of F4/80 immunostains (n = 4 mice per group). (E) Clockwise gating strategy from CD45+ live cells, showing putative immune cell populations (sub-population number as % of parent population shown in red, remaining cells shown in black). (F–H) Flow cytometry analysis of immune cell sub-populations (n = 3–12 mice per group). KC; Kupffer cell, Neu; neutrophil, Mono; monocyte, pDC; plasmacytoid dendritic cell, NK; natural killer, ILC; innate lymphoid cell, Mac; non-Kupffer macrophages Ly6Chi; Ly6Chi monocyte, Ly6Clo; Ly6Clo monocyte. Statistical analysis used Kruskal-Wallis test (D), or one-tailed Mann-Whitney test (F–H), *p < 0.05, **p < 0.01.

