Figure 6.
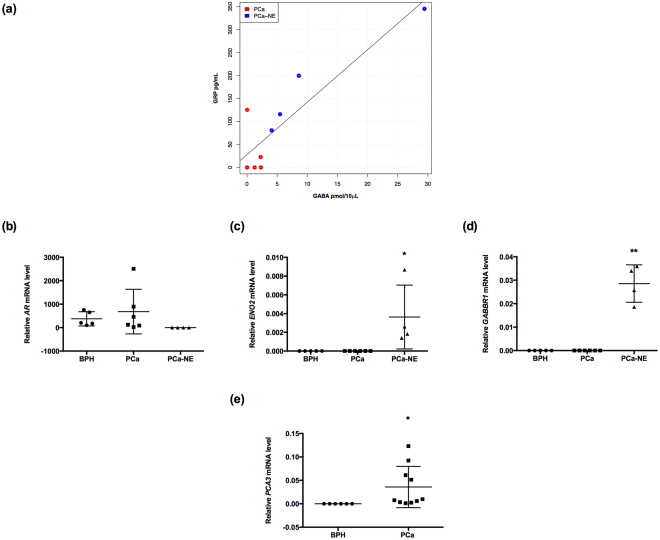
GABA levels are positively correlated with GRP levels in patients with NE markers. (a) A positive correlation between GABA and GRP levels was found in PCa patients (r = 0.894; p = 0004; n = 10), and when patients were separated, PCa-NE patients had a strong positive correlation (r = 0.961; p = 0.03; n = 4). (b–d) Relative AR, ENO2 (*p < 0.05), GABBR1 (**p < 0.001) gene expression in BPH vs. PCa and BPH vs. PCa-NE, respectively. AR mRNA levels were not significantly different between groups. (e) PCA3 mRNA levels were significantly higher in PCa patients compared to BPH patients (*p < 0.05).

