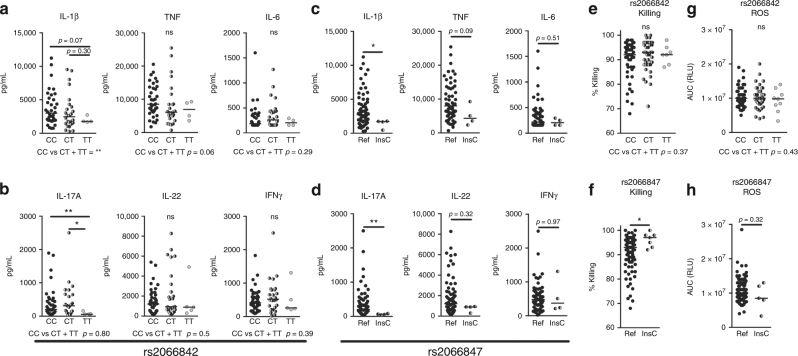
Fig. 2.
Human NOD2 polymorphisms influence Aspergillus-induced cytokine responses and fungal killing. a–d IL-1β, TNF, IL-6, IL-17A, IL-22, and IFNγ levels measured in culture supernatants of PBMCs stimulated with (a, c) live Aspergillus conidia for 24 h or (b, d) heat-inactivated (HI) Aspergillus conidia for 7 days. The PBMCs of individuals with various genotypes of the NOD2 gene were compared. These genotypes included (a, b) the P268S mutation (rs2066842; reference: CC n = 36, heterozygous: CT n = 28 and homozygous: TT n = 4) and (c, d) the 1007finsC mutation (rs2066847; reference n = 62 and heterozygous: insC n = 4). e, f Fungal killing capacity of human PBMCs assessed as CFU remaining of A. fumigatus (2 × 10⁶) following exposure for 24 h to (5 × 10⁵) PBMCs results are stratified based on the e P268S (rs2066842; ref: CC n = 49, heterozygous: n = 45 and homozygous: TT n = 7) and (f) 1007finsC (rs2066847; ref n = 98 insC n = 7) genotypes. g, h Area under the curve (AUC) of relative light units (RLU) induced by luminol oxidation by reactive oxygen species (ROS) released by PBMCs, results are stratified based on the (g) P268S (rs2066842; reference: CC n = 47, heterozygous: n = 50 and homozygous: TT n = 9) and (h) 1007finsC (rs2066847; ref n = 112 insC n = 5) genotypes. Data are represented scatter dot plot with the median. Each dot represent an individual patient, with (a, b, e, g) black filled dots representing carriers of the ancestral (reference) CC genotype, half-filled black/gray dots representing carriers of the heterozygous CT genotype, and gray dots representing carriers of the homozygous TT genotype, and (c, d, f, h) black filled dots representing carriers of the reference (ref) genotype without insertion and half-filled black/gray dots representing carriers of one Cysteine insertion (insC). The means were compared using the Mann–Whitney U test, p-values of statistical tests are shown within the graphs

