Fig. 8.
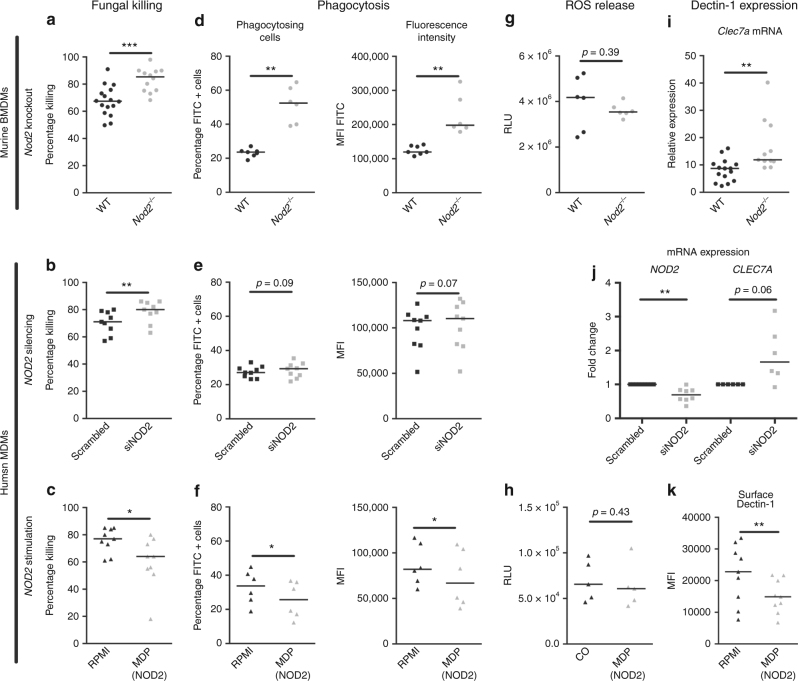
NOD2 negatively regulates, fungal killing, phagocytosis, and dectin-1 expression. a–c The fungal killing capacity of macrophages (1 × 10⁵) assessed by CFU remaining of A. fumigatus (2 × 10⁶) following exposure for 24 h, in (a) wild-type and Nod2−/− BMDMs (n = 16 WT, n = 12 Nod2−/−). b human GM-CSF differentiated MDMs treated (n = 9) for 48 h with siRNA targeting NOD2 or non-targeting siRNA, and c human GM-CSF differentiated MDMs (n = 9) treated for 48 h with the NOD2 ligand (10 μg/mL) MDP. Phagocytosis efficiency assessed as percentage of macrophages that engulfed FITC-labelled A. fumigatus conidia and mean fluorescence intensity of the total macrophage population in (d) wild-type and Nod2−/− BMDMs (n = 16 wt, n = 12 Nod2−/−), (e) human GM-CSF differentiated MDMs (n = 9) treated for 48 h with siRNA targeting NOD2 or non-targeting siRNA, and (f) human GM-CSF differentiated MDMs (n = 6) treated for 24 h with the NOD2 ligand (10 μg/mL) MDP. g, h The area under the curve of the reactive oxygen species release of (g) wild-type (n = 6) and Nod2−/− (n = 6) BMDMs or (h) human MDMs (n = 5) treated for 24 h with the NOD2 ligand (10 μg/mL) MDP in response to zymosan (150 µg/mL) measured by luminescence signal from luminol conversion over 1 h. i Dectin-1 (Clec7a) expression assessed by qPCR in wild-type and Nod2−/− BMDMs (n = 14 wt, n = 10 Nod2−/−), (j) NOD2 (n = 8) and CLEC7A (n = 6) mRNA expression in human GM-CSF differentiated MDMs treated for 48 h with siRNA targeting NOD2 or non-targeting siRNA, and (k) Surface dectin-1 expression measured by flow cytometry on human GM-CSF differentiated MDMs treated for 28 h with the NOD2 ligand (10 μg/mL) MDP. Data is represented as scatter dot plot with median with (a, d, g) black dots representing wild-type mice and grey dots representing Nod2 deficient mice, (b, e, j) black squares representing human macrophages treated with scrambled siRNA and grey squares human macrophages treated with NOD2 targeting siRNA, and black triangles representing MDMs without MDP pre-treatment and grey triangles MDMs with MDP pre-treatment. Means were compared using the Mann–Whitney U test for murine BMDMs (a, d, g, i) and the Wilcoxon signed-rank test was paired comparisons following siRNA treatment (b, e, j), or MDP stimulation (c, f, h, k)

