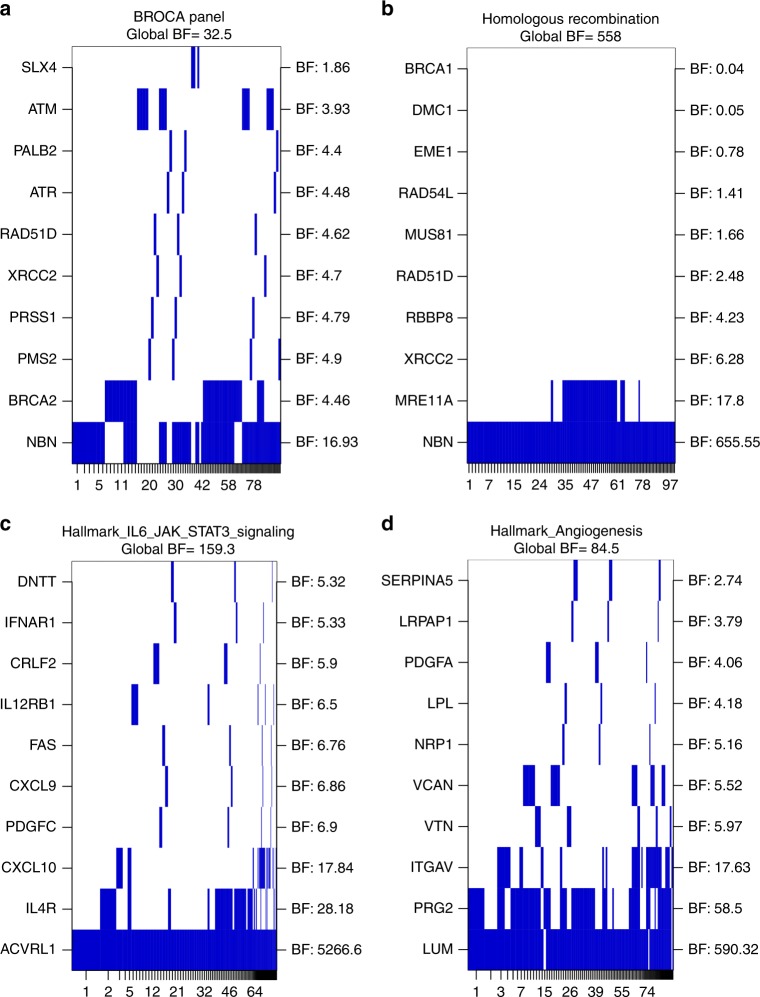
Fig. 2.
Bayesian Risk Index gene set analysis results. a BROCA gene set. b Homologous Recombination Pathway gene set. c Hallmark IL6/JAK/STAT Signalling gene set. d Hallmark Angiogenesis gene set. Analyses for differential burden of damaging variants between metastatic and non-aggressive cohorts were conducted for variants with MAF < 1% using Tier 1 variants only (BROCA gene set), or Tier 1 & 2 combined (Homologous Recombination Pathway and Hallmark gene sets). Each gene in the gene set was analysed as an individual region, with the top 10 genes included in the models depicted as rows in the plot, ordered according to gene level region Bayes Factor (BF). The gene regions or combinations of regions for the top models (indexed by the numbers on the x-axis) are plotted in the columns. These columns have widths proportional to and are ordered based on the posterior probability of the corresponding model. Global Bayes Factors for the entire gene set are indicated above each plot

