
Fig. 6.
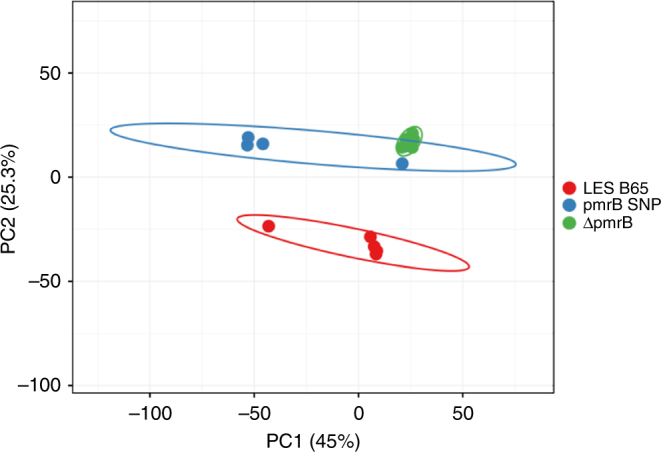
Principal component biplot of LESB65, pmrB SNP and ΔpmrB. Unit variance scaling is applied to rows; SVD with imputation is used to calculate principal components. X axis and Y axis show principal component 1 and principal component 2 that explain 45% and 25.3% of the total variance, respectively. Prediction ellipses are such that with probability 0.95, a new observation from the same group will fall inside the ellipse. N = 15 data points