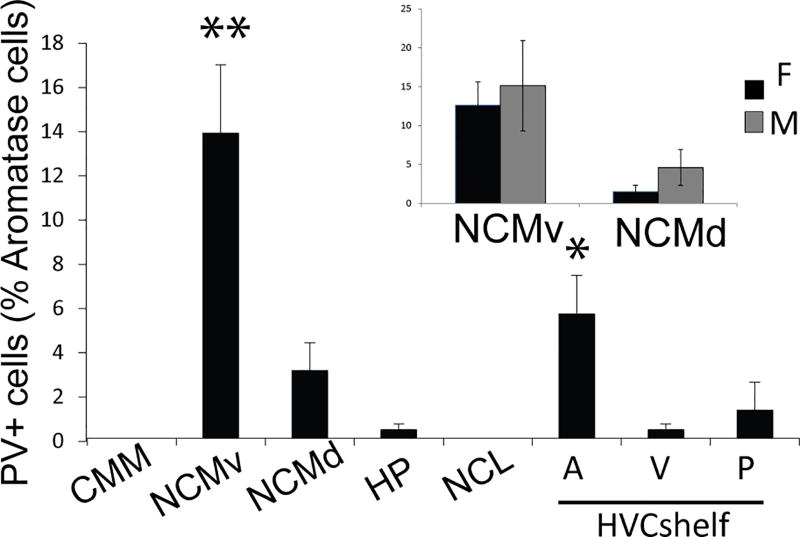
Figure 5. A subset of aromatase+ cells co-express PV.
Quantification of PV+ aromatase+ cells. Inset, data from NCM separated by sex. No significant differences are found between the two sexes (Anova, Sex*Region: p>0.05; Sex, p>0.05; Region, p=0.038). CMM, N=9; NCMv, N=11; NCMd, N=11; HP, N=9; NCL, N=7; HVCshelf: A, N=8; V, N=8; P, N=8. Asterisks indicate significant regional differences. p<.05*, p<.01**.

