. 2018 Apr 25;16(2):e12757. doi: 10.5812/ijem.12757

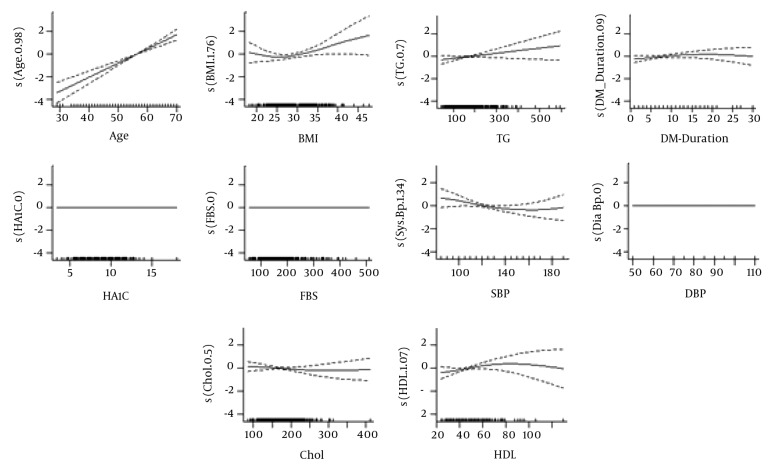
Figure 1. The shape of associations between covariates and functional limitation in patients with diabetes. Legend: The x - axis contains the covariates values and the y - axis contains the logit of functional limitation produced by GAM model. This plot takes the fitted values and plots the component smooth functions that make it up on the scale of the linear predictor. Upper and lower lines are +1 and -1 standard errors. Abbreviations: BMI, body mass index; Chol, cholesterol; DBP, diastolic blood pressure; DM, diabetes mellitus; FBS, fasting blood sugar; HbA1C, glycated hemoglobin; HDL, high density lipoprotein; SBP, systolic blood pressure; TG, triglyceride.

Figure 1.