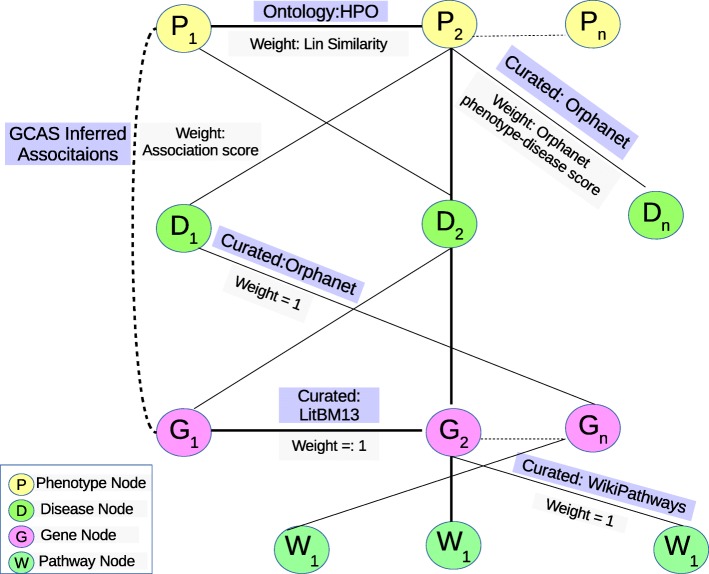
Fig. 1.
The figure shows the various curated, ontological and inferred association types in HANRD. The HANRD edges could be between Phenotypes, Diseases, Genes and Pathways. The edges are undirected and weighted. The dotted lines indicate the inferred edges. Along with each edge type, the weight assignment scheme and the information source for the edge is also shown

