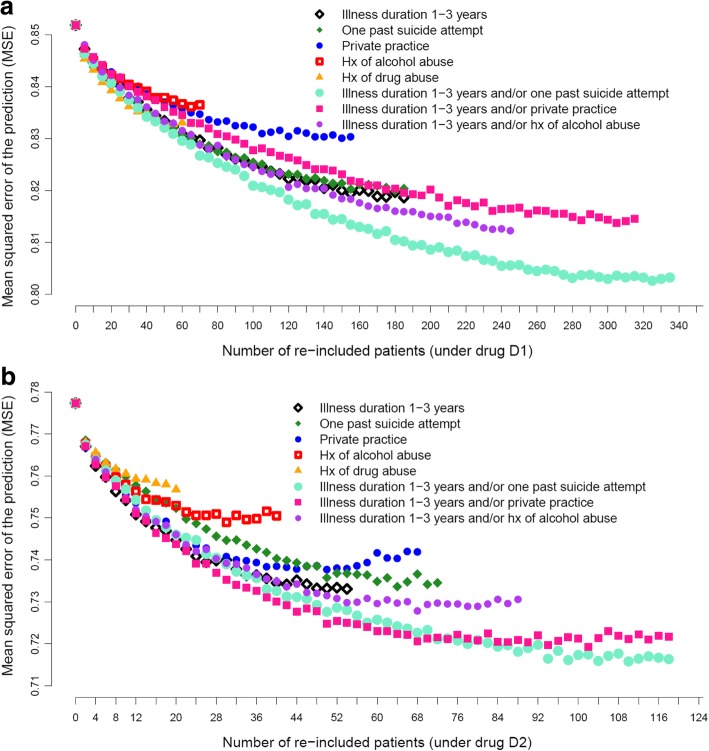
Fig. 3.
Mean squared error of the prediction from model fitted to data from augmented RCT populations of patients initiating drug D1 (a) or drug D2 (b). The augmentation was performed by re-including, through random replacement within the RCT population, an increasing number of patients (x-axis) from eight different real-world subpopulations (colored markers) until the natural percentage of the patients with that specific characteristic was reached (right end of each curve). Each point represents an average of 500 random samplings of re-included patients

