Fig. 2.
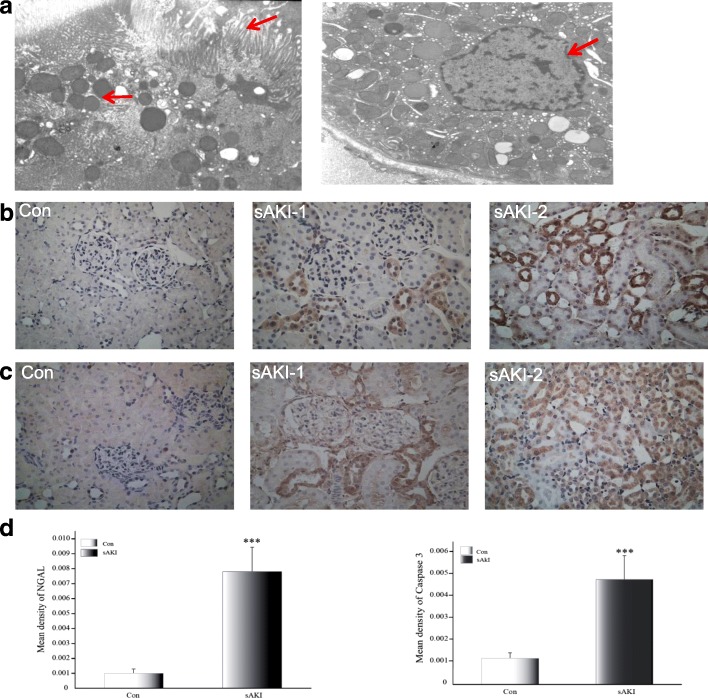
a Renal tubular epithelial cell injury and apoptosis observed under TEM at 6 h after LPS treatment (TEM, 5000×). Arrows indicate disarrayed microvilli, mitochondrial ballooning, and unevenly distributed nuclear chromatin in the outer nuclear layer gathered toward the center. TEM: transmission electron microscopy, LPS: lipopolysaccharide. b Localization of NGAL protein expression in rat kidneys under light microscopy 6 h after LPS treatment. Con: Control group, sAKI-1: renal cortex of sAKI group, sAKI-2: renal medulla of the sAKI group. (original magnification 400×). NGAL: neutrophil gelatinase-associated lipocalin, LPS: lipopolysaccharide. c Localization of caspase 3 protein expression in rat kidneys under light microscopy at 6 h after LPS treatment. Con: Control group, sAKI-1: renal cortex of sAKI group, sAKI-2: renal medulla of the sAKI group. Original magnification 400×. LPS: lipopolysaccharide. d Semi-quantification of immunohistochemical staining for NGAL and caspase 3 in kidneys of Con and sAKI rats. Data are expressed as means ± SD. ***p < 0.001, relative to controls

