
Fig. 8.
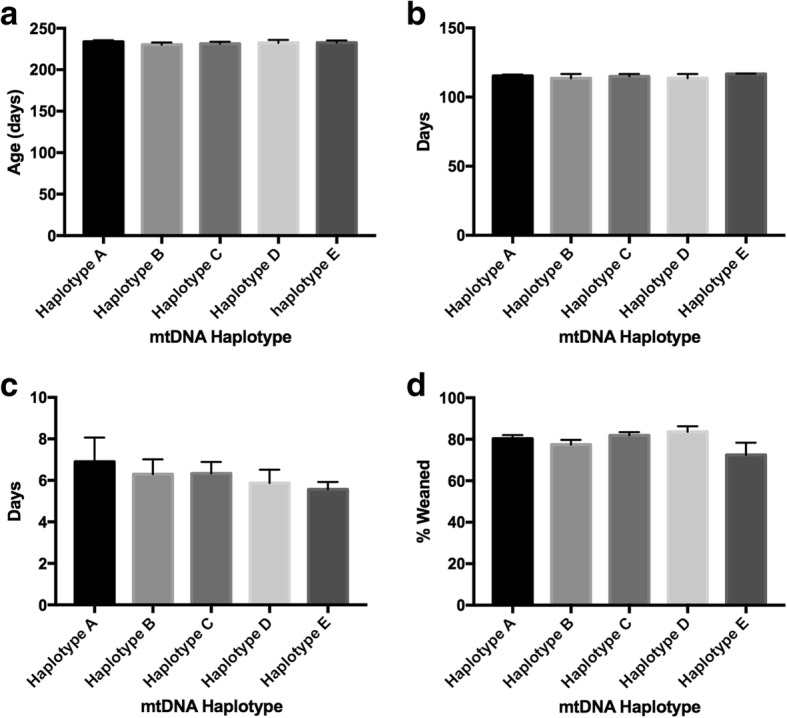
Assessment of phenotypic traits relative to mtDNA haplotype for all animals investigated. Graphs represent mean ± SEM values for (a) age of gilt at selection; (b) gestational length; (c) length of the weaning to oestrus interval; and (d) percentage of offspring weaned. No significant differences were found in each of the tests amongst the mtDNA haplotypes