Fig. 3.
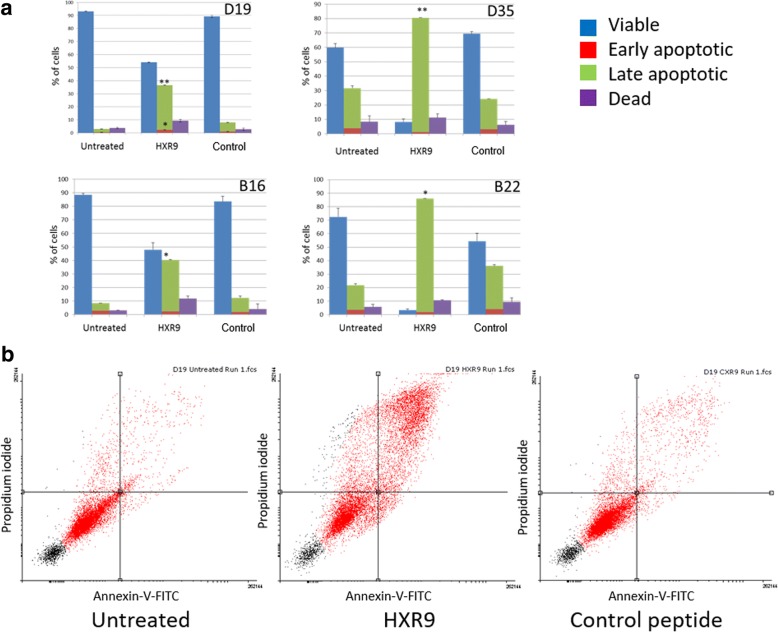
Panel a: Induction of apoptosis (assessed by translocation of phosphatidylserine by Annexin-V) in untreated cells and on treatment of cells with CXR9 and HXR9 at EC50 for 2 h 45 min. Blue = viable, red = early apoptotic, green = late apoptotic and purple = dead. Comparisons are of % of late apoptotic cells: Mean±SEM from three individual experiments. *p < 0.05, **p < 0.01. Panel b: Exemplar scatter plots for the PMOL cell line D19 cells: untreated, HXR9 treated and control (CXR9) treated. Each quadrant represents a cell status; clockwise from upper left: dead, late apoptotic, early apoptotic and viable

