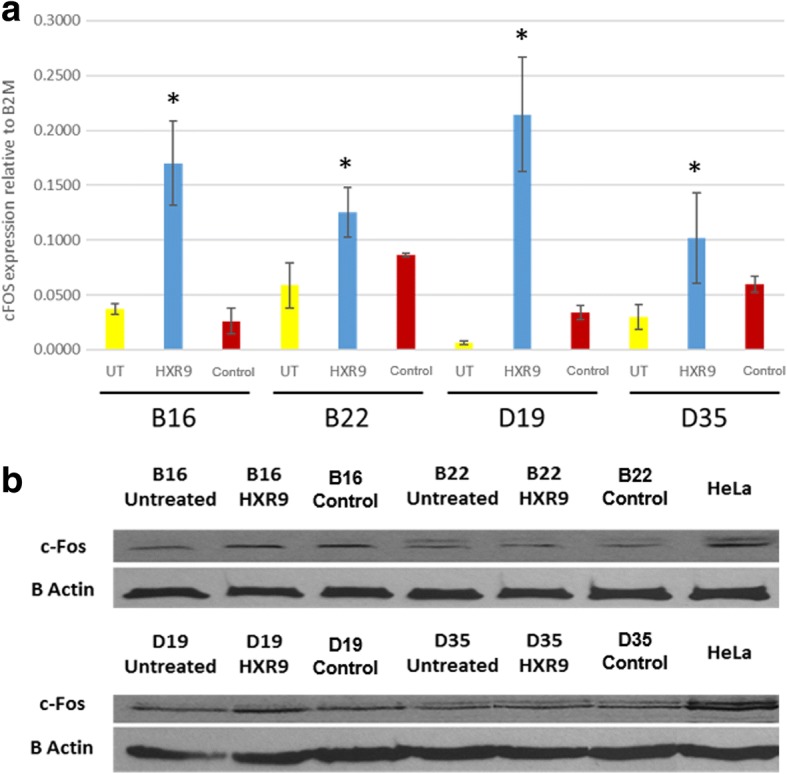
Fig. 4.

Panel a: Expression of c-Fos by qPCR untreated cells and cells treated with HXR9 or control peptide (CXR9) at EC50. Mean±SEM from three independent experiments, relative to U6. *p < 0.05. Panel b: Expression of c-Fos by western blot in untreated cells and cells treated with HXR9 or control peptide (CXR9) at EC50. β-actin was used as a loading control
