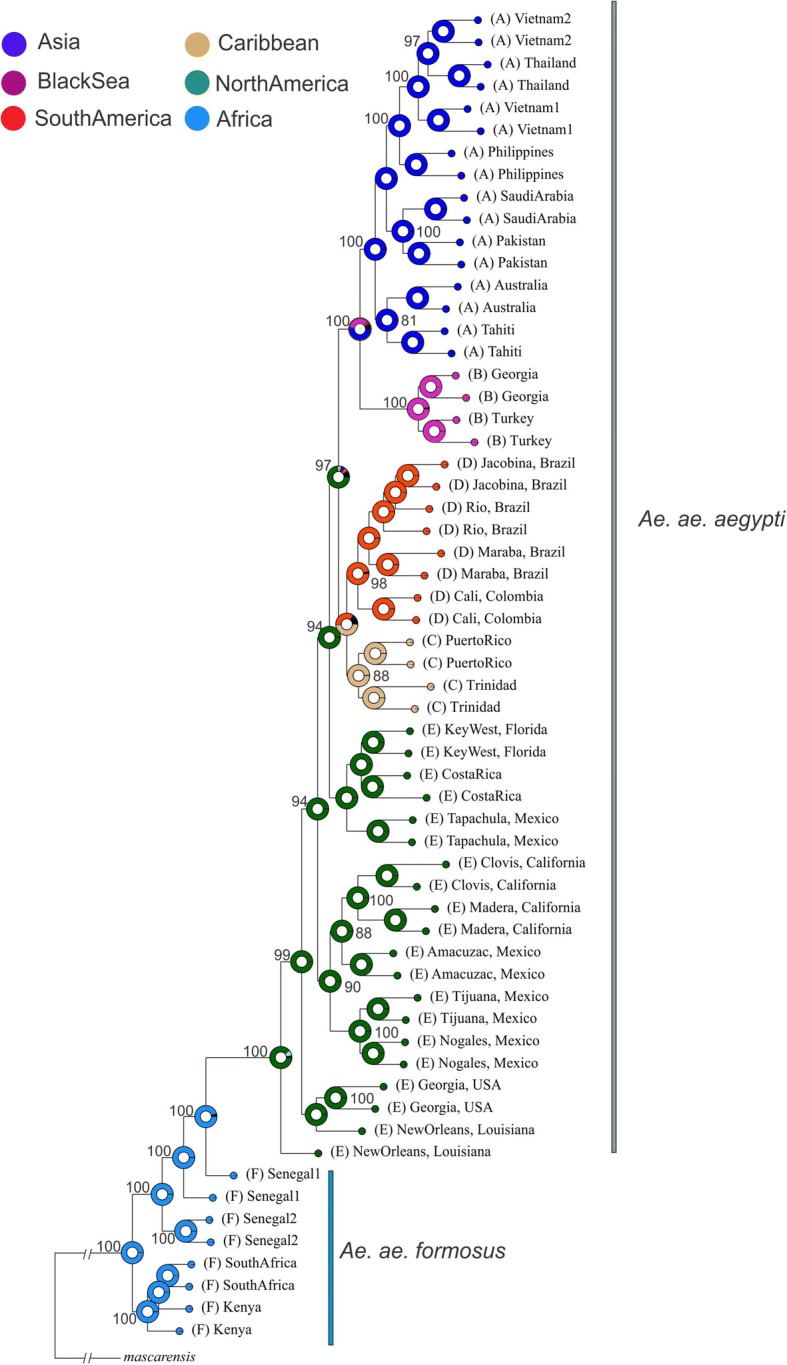
Fig. 7.

Maximum Likelihood (ML) rooted phylogenetic tree reconstructed using ~19,000 SNPs. Aedes mascarensis was used as outgroup. Bootstraps are presented on the nodes, and for visualization purposes values < 88 are not shown. This ML tree was used for Bayesian Binary MCMC (BBM) analysis. For BBM, six geographical regions were pre-defined based on the current distribution of the sampled populations and they are shown with different tip colors. The colors in the pies on the nodes indicate the probabilities of ancestry of the individuals that were included in the respective clade
