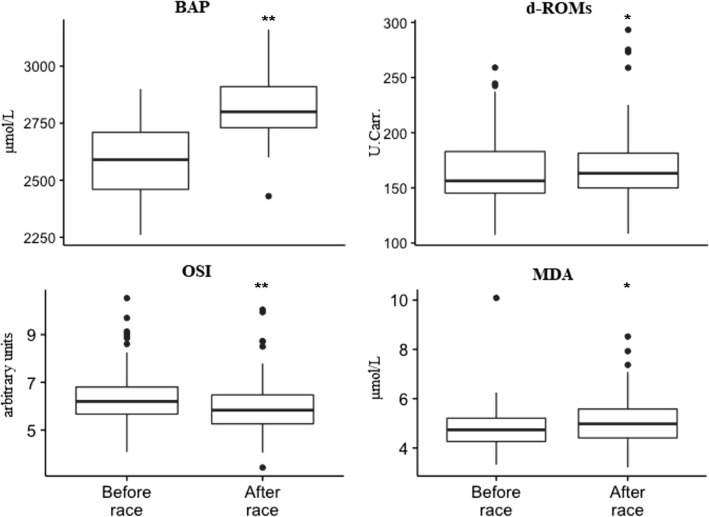
Fig. 1.
Boxplots of values of the OS biomarkers in endurance horses pre- and post-races. The data represents measurements from 53 race runs of 28 individual horses over four racing events. The null hypothesis states there is no difference between the two (i.e., the delta change being zero). Significant differences from values at baseline (before race); *P < 0.01; **P < 0.001; d-ROMs, determination of reactive oxidative metabolites; BAP, biological antioxidant potential; MDA, malondialdehyde; OSI, oxidative stress index

