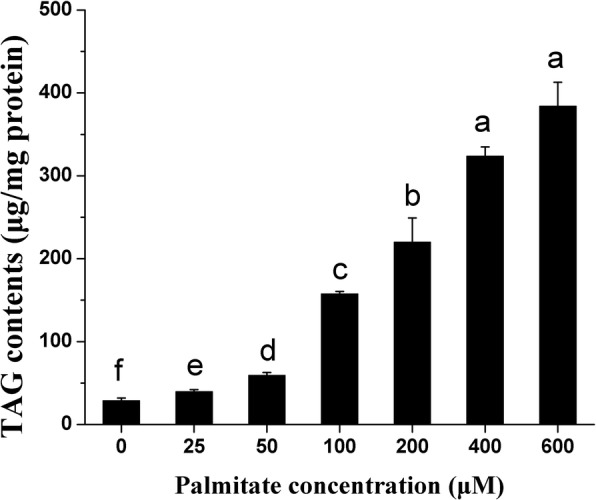
Fig. 2.

Effect of palmitate on cellular TAG content in pMECs. pMECs were incubated for 24 h with different concentrations of palmitate (0 (control), 25, 50, 100, 200, 400, and 600 μM). The data are expressed as the mean ± SEM (n = 6). Different letters indicate statistical significance between different concentrations of palmitate treatment groups (p < 0.05)
