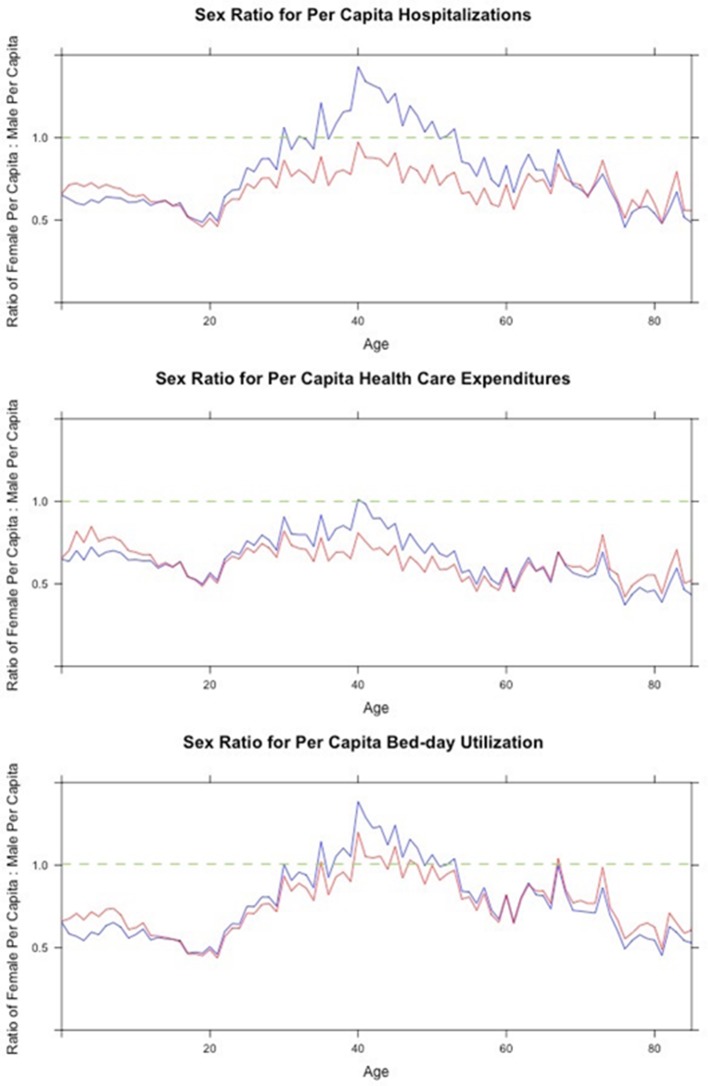
Figure 3.
Sex ratio of per capita rates of hospitalisation, hospital expenditure and bed-day utilisation. The blue line represents per capita values for all conditions and the red line represents per capita values for all sex-neutral conditions. A value of 1.0 represents equivalence between the sexes (green dotted line).

