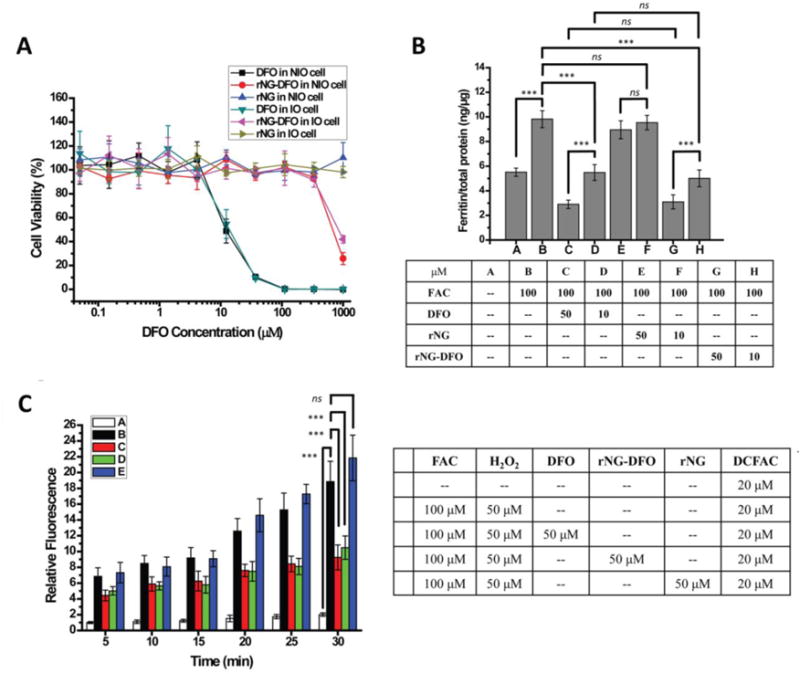
Fig. 2.

(A) Cytotoxicity of free DFO, rNG and rNG-DFO in NIO and IO macrophage cells after 48 h incubation; a representative set of data is shown where each data point is presented as the mean ± SD (n = 3). (B) Ferritin reduction ELISA assay to monitor iron chelation efficacy. NIO cells were only treated with DMEM complete medium over the period of the study (bar A); cells were IO by 24 h incubation with 100 μM FAC and left untreated (bar B); IO cells were treated for 48 h with either 50 μM DFO (bar C) or 10 μM DFO (bar D), equivalent rNG (bar E and bar F) based on w/v of rNG-DFO, and 50 μM rNG-DFO (bar G) or 10 μM (bar F) rNG-DFO to equivalent DFO. Results are normalized to total protein (ng/μg) and presented as mean ± SD (n = 3). “ns” means the difference was not significant. *** p < 0.001. (C) Time dependent iron-mediated oxidative stress levels in vitro after incubating IO cells with DFO, rNG, and rNG-DFO. The ROS-sensitive fluorescent probe DCFDA was used as an indicator of ROS levels in cells.
