
Fig. 3.
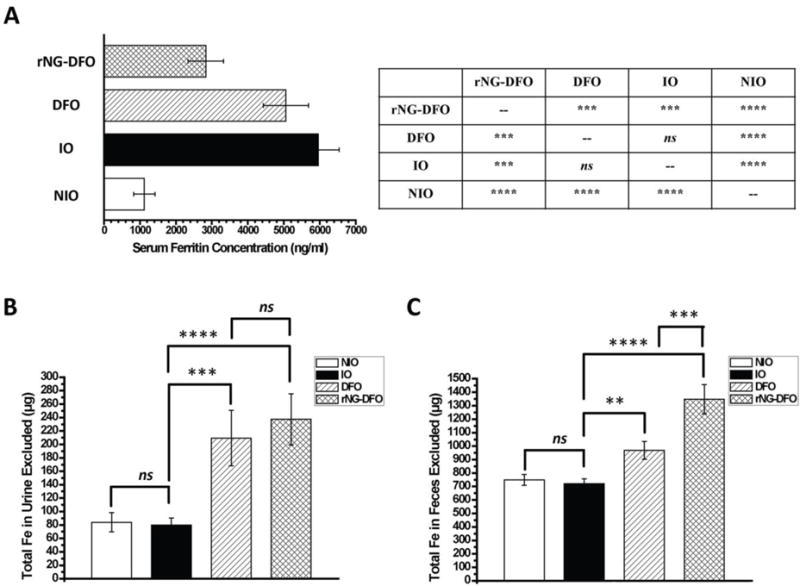
(A) Final serum ferritin levels in IO mice was measured via a colorimetric mouse ferritin ELISA assay. Statistical significance between the different groups is summarized in the Table next to the bar graph, where results are presented as mean ± SD (n = 3), “ns” means the difference was not significant, *** p < 0.001, and **** p < 0.0001. Total iron elimination trends in urine (B) and feces (C) of IO mice; results are presented as mean ± SD (n = 3). “ns” means the difference was not significant, ** p < 0.01, *** p < 0.001, **** p < 0.0001.