
Fig. 6.
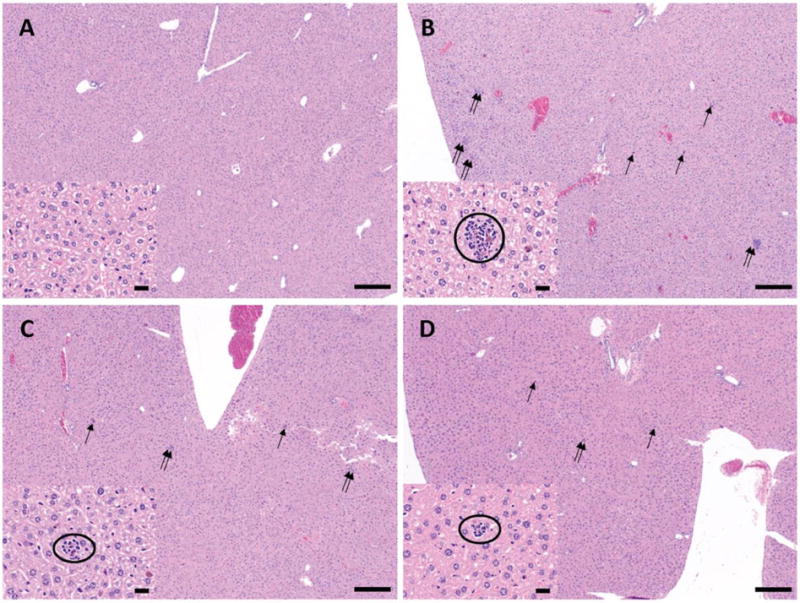
Representative photomicrograph of liver sections stained with H&E from the various treatment groups: (A) NIO mouse, (B) IO mouse without treatment, (C) IO mouse with DFO treatment and (D) rNG-DFO treatment; double arrows and single arrows are used to show the hypercellularity and iron-containing cells respectively (40× original magnification, scale bar equals 200 μm). Within each panel, the insets show a higher magnification of a selected area where inflammatory cells around a hemosiderin-laden Kupffer cells and minimal cellular debris are circled (400× original magnification, scale bar equals 20 μm).