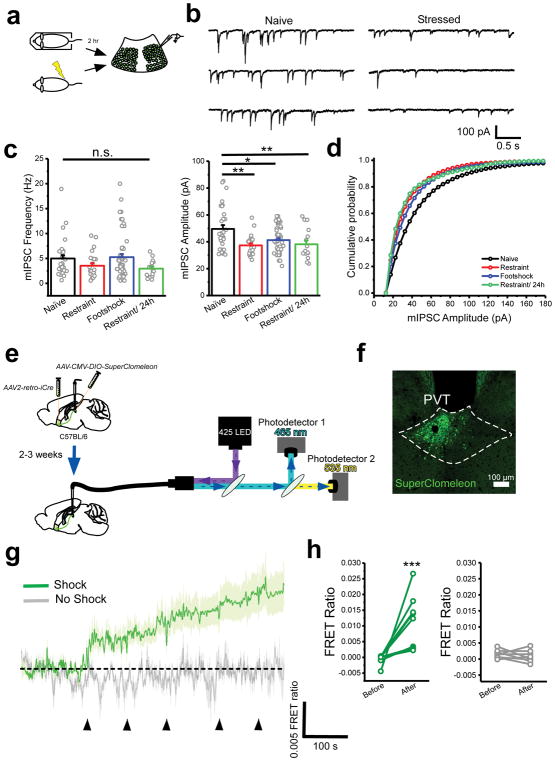
Figure 1. Synaptic inhibition in the pPVT rapidly decreases following stress.
a. Schematic of the approach for individually assessing the effect of footshock and restraint stress on synaptic inhibition in D2+ neurons of the pPVT. b. Sample mIPSC traces obtained from D2+ neurons of naïve (left panels) and stressed (right panels) mice. c. Quantification of mIPSC amplitude (right) and frequency (left). Amplitude in pA, naïve, 49.55 ± 2.90, n = 31 neurons, 4 mice; restraint, 37.35 ± 1.50, n = 24 neurons, 4 mice; footshock, 41.30 ± 1.85, n = 51 neurons, 4 mice; restraint/24h, 38.15 ± 2.88, n = 16 neurons, 2 mice; F(3,97) = 5.80, one-way analysis of variance (ANOVA) followed by Tukey’s test. Group comparisons: naïve vs restraint, **P=0.0011; naïve vs footshock, *P=0.012; naïve vs restraint/24h **P=0.01. Frequency in Hz, naïve, 4.99 ± 0.67, n = 31 neurons; restraint, 3.54 ± 0.52, n = 24 neurons; footshock, 5.25 ± 0.65, n = 30 neurons; restraint/24h, 2.97 ± 0.42, n = 16 neurons; F(3,97) = 2.08, one-way ANOVA followed by Tukey’s test. Group comparisons: naïve vs restraint, non-significant P=0.50; naïve vs footshock, non-significant P=0.99; naïve vs restraint/24h non-significant P=0.31. d. Cumulative probability distribution of mIPSC amplitude. e. Schematic of the experimental design used for fiber photometry chloride imaging of NAc-projecting pPVT neurons. f. Representative image of SuperClomeleon expression in NAc-projecting neurons of the pPVT. g. Average SuperClomeleon response from NAc-projecting pPVT neurons in animals subjected to footshocks. Individual footshocks depicted by arrowheads. h. Average change in baseline fluorescence following footshock stress (left) and no shock (right) shown as FRET ratio x 10−3 (footshock: Before, −0.50 ± 0.51; After, 10.73 ± 2.84; **P=0.007, two-sided Paired sample t-test; no shock: Before, 1.48 ± 1.35; After, 1.52 ± 4.11; n = 9 mice; P=0.35, two-sided Paired sample t-test). Data shown as mean ± s.e.m.

