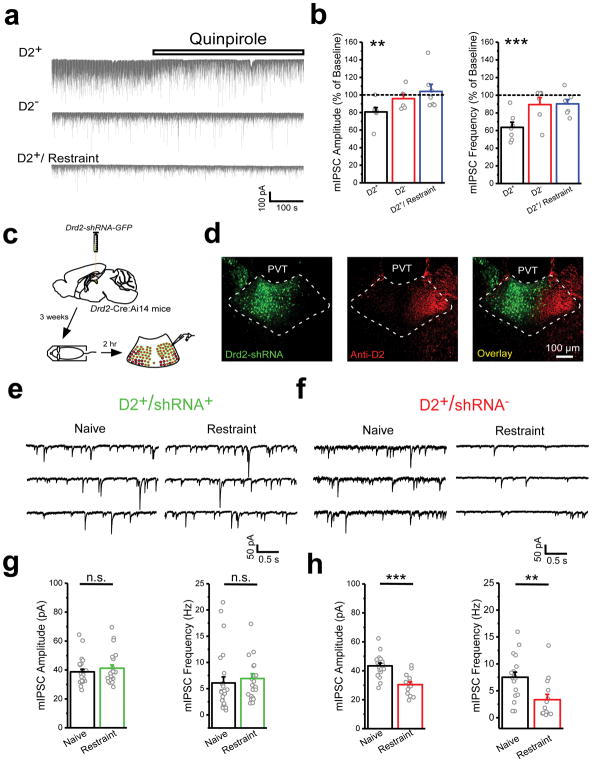
Figure 2. Activation of D2-like dopamine receptors both mimics and is required for stress-induced downregulation of inhibitory transmission.
a. Representative traces showing the effect of the D2-like agonist quinpirole (10 μM) on the amplitude and frequency of mIPSC recorded from D2+ (top) and D2− (middle) neurons of the pPVT of naïve mice, and D2+ neurons of the pPVT of restraint (bottom) mice. b. Percent of baseline of mIPSC amplitude (left) and frequency (right) following bath application of quinpirole in D2+ (black) and D2− (red) neurons of the pPVT of naïve mice, and D2+ neurons of the pPVT of restraint mice (blue). Amplitude percent of baseline, D2+, 80.71 ± 4.94, n = 7 neurons, 4 mice, **P=0.008, two-sided Paired sample t-test; D2−, 95.77 ± 4.90, n = 6 neurons, 2 mice, P=0.43, two-sided Paired sample t-test; D2+/restraint, 104.01 ± 8.07, n = 7 neurons, 4 mice, P=0.64, two-sided Paired sample t-test. Frequency percent of baseline, D2+, 63.53 ± 5.87, n = 7 neurons, 4 animals, ***P=0.0008, two-sided Paired sample t-test; D2−, 89.37 ± 7.87, n = 6 neurons, 6 animals, P=0.24, two-sided Paired sample t-test; D2+/restraint, 90.17 ± 4.78, n = 7 neurons, 4 animals, P=0.10, two-sided Paired sample t-test. c. Schematic of the experimental design used to determine the contribution of D2+ receptors of the pPVT to stress-induced reduction in GABAergic transmission. d. Representative images of Drd2-shRNA-GFP expression in the pPVT and immunohistochemical assessment of D2 protein via antibody staining (knockdown efficiency = 60% [See Methods]; n = 4 mice). e. Sample mIPSC traces obtained from shRNA-expressing D2+ neurons (D2+/shRNA+) of naïve (left panels) and stressed (right panels) knockdown mice. f. Sample mIPSC traces obtained from shRNA-negative D2+ neurons (D2+/shRNA−) of naïve (left panels) and stressed (right panels) knockdown mice. g. Quantification of mIPSC amplitude (left) and frequency (right) from D2+/shRNA+ neurons. Amplitude in pA, naïve, 38.73 ± 1.79, n = 23 neurons, 4 mice; restraint, 42.27 ± 2.48, n = 25 neurons, 3 mice; non-significant, P=0.40; two-sided t-test. Frequency in Hz, naïve, 6.10 ± 1.15, n = 23 neurons, 4 mice; restraint, 7.54 ± 0.52, n = 25 neurons, 3 mice; non-significant, P=0.58; two-sided t-test. h. Quantification of mIPSC amplitude (left) and frequency (right) from D2+/shRNA− neurons. Amplitude in pA, naïve, 43.41 ± 1.91, n = 18 neurons, 3 mice; restraint, 30.43 ± 1.94, n = 14 neurons, 3 mice; ***P=0.00005; two-sided t-test. Frequency in Hz, naïve, 7.52 ± 0.96, n = 18 neurons, 3 mice; restraint, 3.73 ± 0.99, n = 14 neurons, 3 mice; **P=0.006; two-sided t-test. Data shown as mean ± s.e.m.

