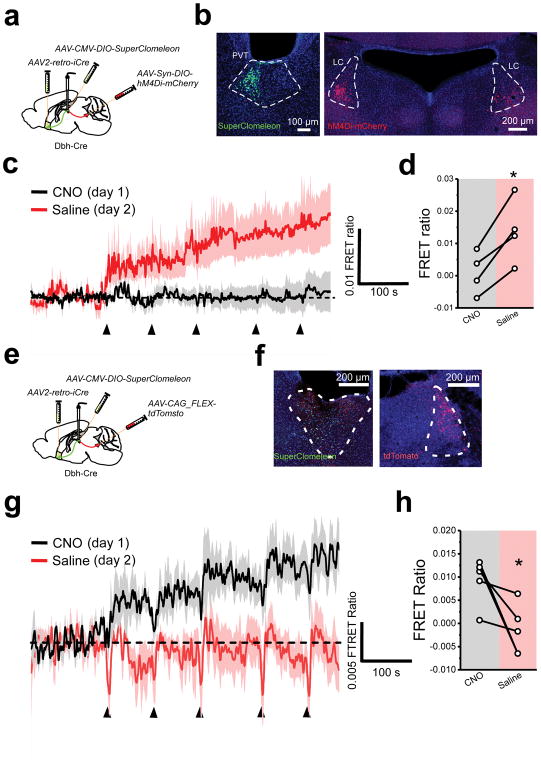
Figure 5. The LC controls stress-induced inhibitory plasticity in the pPVT.
a. Schematic of the stereotaxic injections for selectively expressing SuperClomeleon in NAc-projecting neurons of the pPVT and inhibitory DREADD (hM4Di) in catecholaminergic neurons of the LC using Dbh-Cre mice. b. Representative images showing successful expression of SuperClomeleon and hM4Di-mCherry in the desired targets. Assessment of viral expression was independently repeated four times for this experiment and similar results were obtained. c. Average SuperClomeleon response from NAc-projecting pPVT neurons in animals subjected to footshocks in the presence of CNO (day 1; black) or saline (day 2; red). Individual footshocks depicted by arrowheads. d. Average change in baseline fluorescence following footshock stress shown as FRET ratio x 10−3 (CNO, 0.90 ± 3.29; Saline, 13.90 ± 5.00; n = 4 mice; P=0.013; two-sided t-test). e. Schematic of the stereotaxic injections for selectively expressing SuperClomeleon in NAc-projecting neurons of the pPVT and tdTomato in catecholaminergic neurons of the LC using Dbh-Cre mice. f. Representative images showing successful expression of SuperClomeleon and tdTomato in the desired targets. Assessment of viral expression was independently repeated five times for this experiment and similar results were obtained. g. Average SuperClomeleon response from NAc-projecting pPVT neurons in animals subjected to footshocks in the presence of CNO (day 1; black) or Saline (day 2; red). Individual footshocks depicted by arrowheads. h. Average change in baseline fluorescence following footshock stress shown as FRET ratio x 10−3 (CNO, 9.27 ± 2.24; Saline, −1.47 ± 5.44; n = 5 mice; P=0.044; two-sided t-test). Data shown as mean ± s.e.m.

