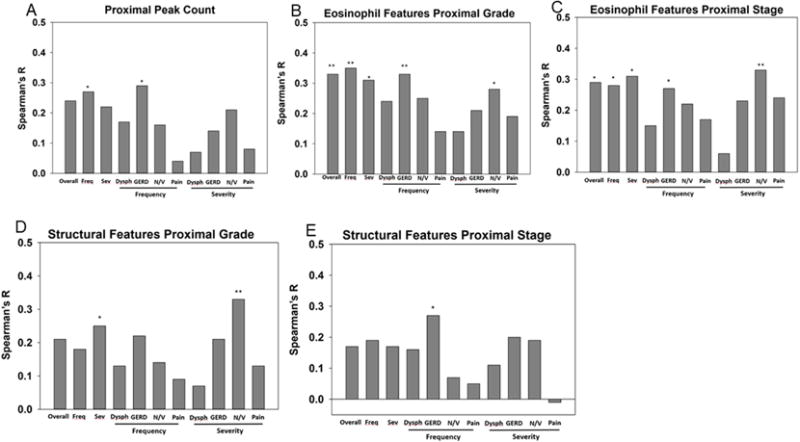
Figure 3. Correlation of proximal eosinophil counts and EoEHSS features with self-reported PEESSv2.0.

Spearman’s r for the correlations between self-reported child PEESS2.0 domains (overall, all frequency (freq), all severity (sev), and dysphagia (dys), GERD, nausea/vomiting (N/V), and pain for frequency and severity) with proximal peak eosinophil counts (A) and proximal EoEHSS eosinophil features for grade (B) and stage (C) and structural features grade (D) and stage (E). *p<0.05, **p<0.01.
