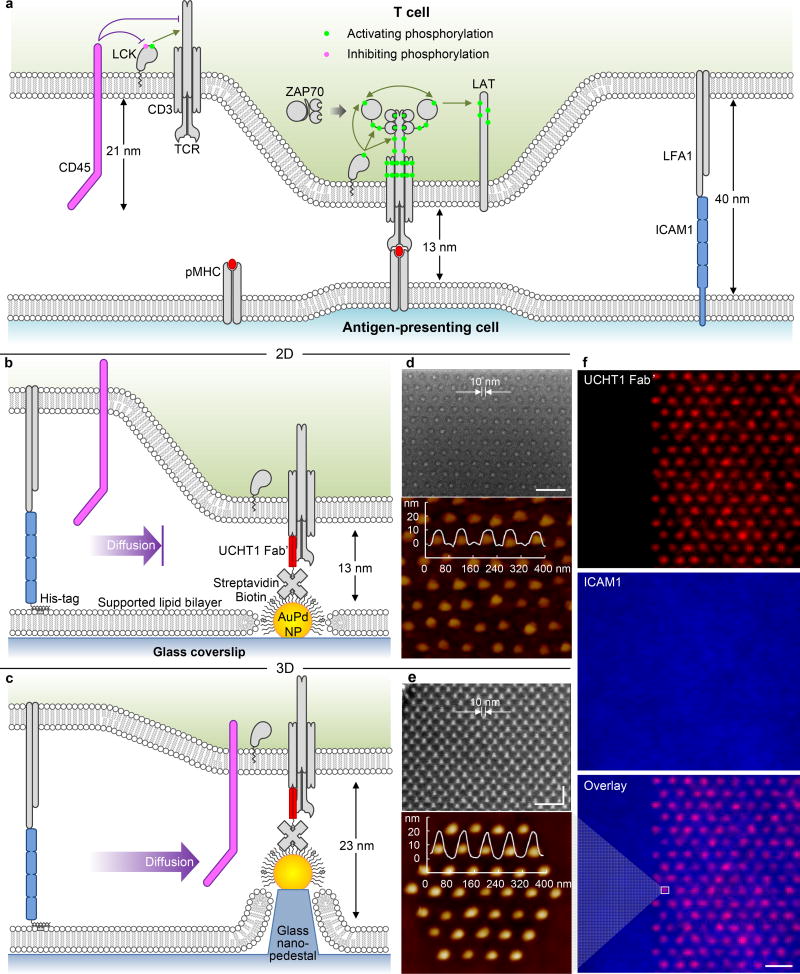
Figure 1. TCR triggering by surface bound ligands.
(a) Triggering by peptide-major histocompatibility complex (pMHC)on an antigen-presenting cell: schematic diagram of the cellular junction, indicating the steps in the TCR signalling cascade, as described in the text. (b–c)Triggering by anti-CD3 antibodies on the nanofabricated platform: schematic diagrams of (b) 2D and (c) 3D surfaces. Scanning electron microscopy (SEM, 40 nm spacing, lateral size ~ 10 nm) and atomic force microscopy (AFM, 80 nm spacing) images of (d) 2D and (e) 3D surfaces (10 nm increment in height). This platform shows precise control on the nanoarray geometry (extended/cluster) and dimension (both in-plane and out-of-plane). (f) Fluorescence images of the platform: UCHT1 Fab’ selectively immobilized on the nanoarrays (NP cluster in e), ICAM1 backfilled on the mobile SLB. Size bar = 100 nm for the SEMs (d,e) and 2 µm for the fluorescence images (f).

