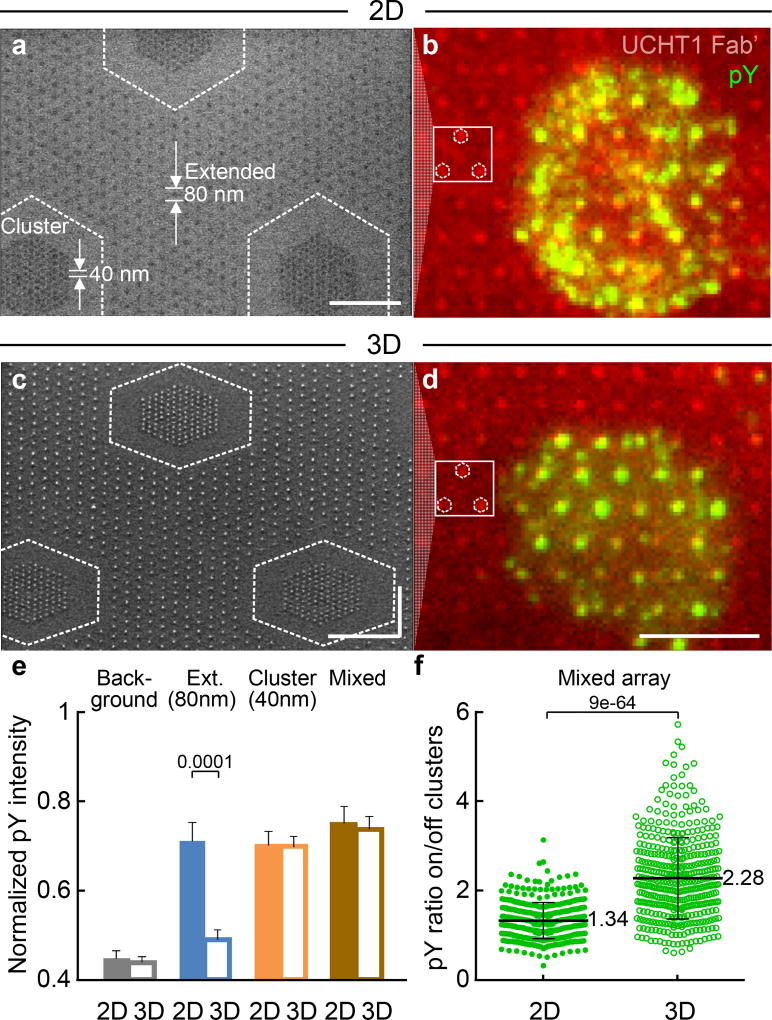
Figure 4. T cells sense ligand position locally.
A mixed array of 40 nm clusters embedded in an 80 nm extended array (c127s40d50/h80d180) for 2D and 3D surfaces. (a) and (c) SEM images (size bar = 500 nm). (b) and (d) Epifluorescence images (size bar = 5 µm). Locations of 40 nm clusters are indicated in SEMs, with corresponding clusters indicated in fluorescence image to aid the eye. On the 2D surfaces, the pY is seen in (b) to be distributed over a cell, both on and off the clusters, with no obvious preference for the 80 nm or 40 nm spaced NPs. On the 3D surfaces, increased pY colocalization with the 40 nm clusters is clearly evident in (d), with much lower intensity off clusters as compared to (b). The experiment was repeated 3 times independently with similar results. (e) Normalized pY intensity on mixed arrays, compared with data from Fig. 3. Data are means ± s.e.m, n >180 cells from 3 independent experiments (Mann–Whitney test, two-sided),as summarized in Supplementary Table S2. (f) pY intensity ratio on/off clusters. Data are means ± s.d., each point representing a cluster in cell, n = 11 cells from 2 independent experiments(Mann–Whitney test, two-sided).Whilst the overall pY intensity for the cells is similar for the 2D and 3D mixed arrays, the difference of pY distribution between 2D and 3D surfaces highlights that a T cell can sense the ligand position and respond locally, even when the spacing is not uniform over the entire cell.

