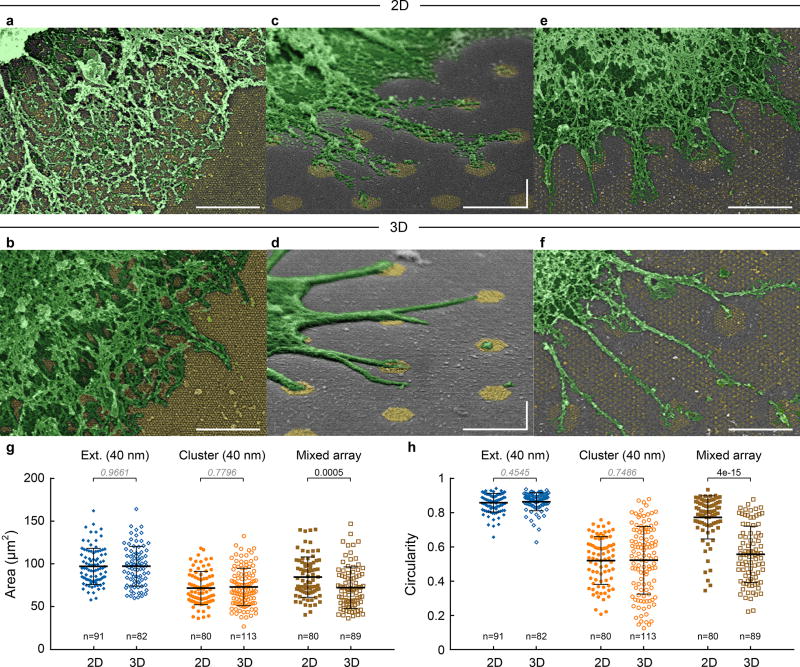
Figure 5. Ligand position affects T cell spreading.
SEM images of lamellipodia on (a) 2D and (b) 3D extended arrays (40 nm spacing, h40d722). Individual filopodia on (c) 2D and (d) 3D cluster arrays (40 nm spacing, c127s40). (e) 2D and (f) 3D mixed arrays (c127s40d50/h80d180). Pseudo-colour, size bar = 1 µm. The experiment was repeated 3 times independently with similar results. (g) Cell spreading area and (h) circularity. Data are means ± s.d., each point representing a cell, n > 80 cells from 2 independent experiments (Mann–Whitney test, two-sided).The difference is not significant if p-value > 0.05 (italic).

