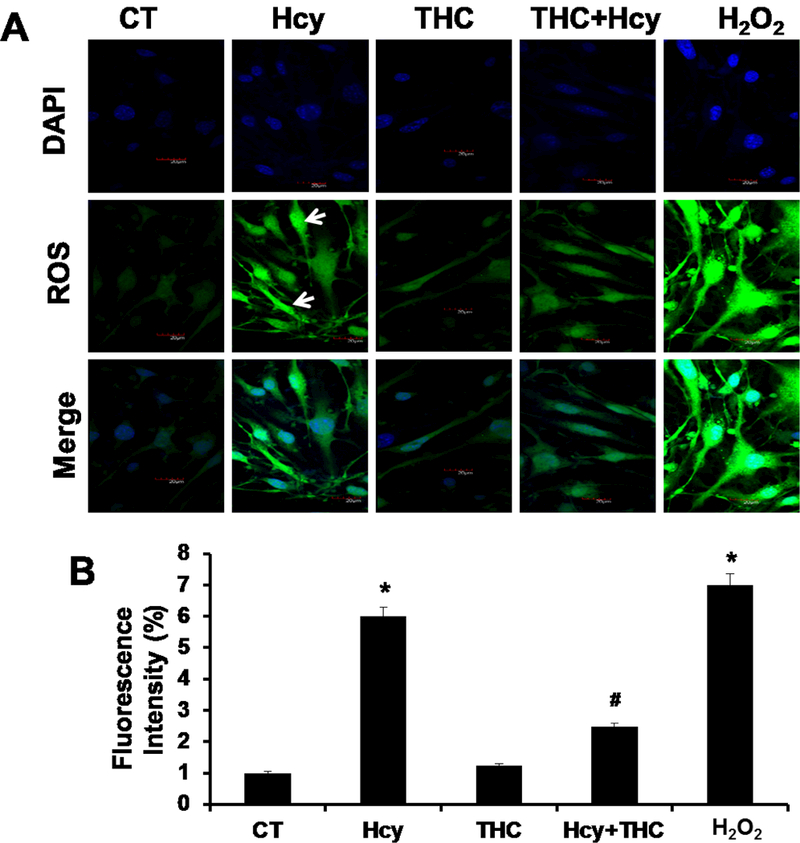
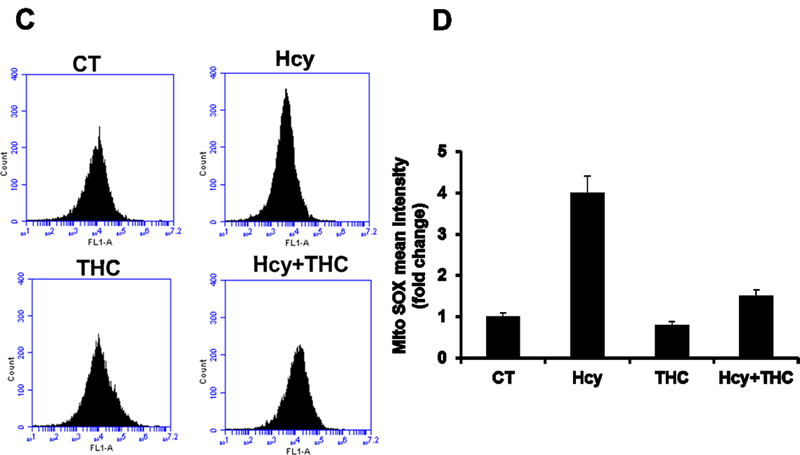
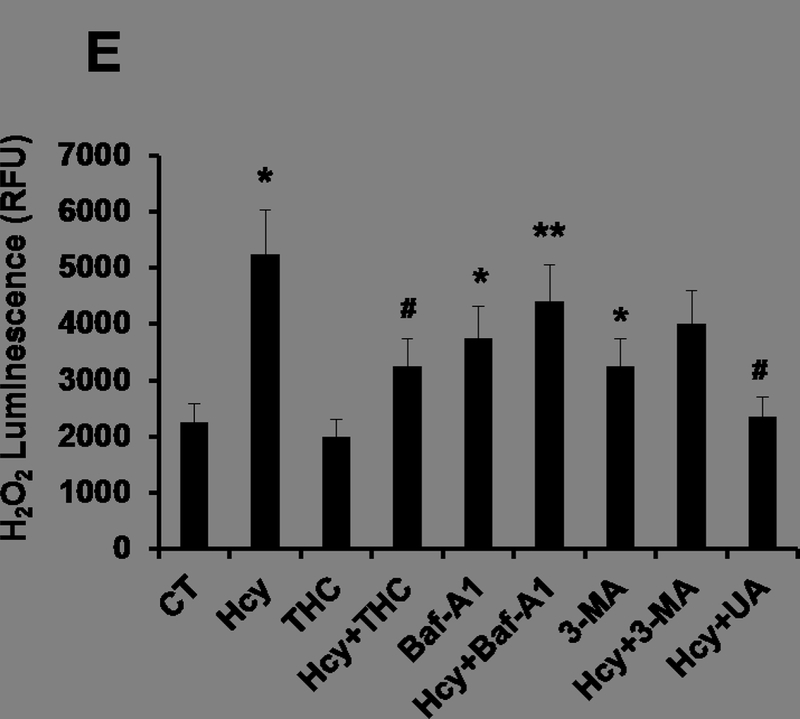
Figure. 2.


Effects of THC on Hcy induced intracellular ROS generation in bEnd3 cells. 2A and 2B. Confocal analysis showing oxidative stress in bEnd3 cells using H2DCF-DA fluorescent dye. Green color intensity is the representation of oxidative stress as indicated by white arrows. Blue color (left most images) represents cell nuclei stained with DAPI. 2C and 2D. Flow cytometry data showing the level of mitochondrial ROS generation in Hcy and THC treated bEnd3 cells using MitoSOX™ Red reagent. 2E. Treatment with Hcy resulted in increased H2O2 production, which reached statistical significance at 500 μM Hcy and was completely abolished by coincubation with both THC (15 μM) and antioxidant uric acid (50 μM). All images were taken at 60X magnification. Data represents mean ± SEM. *P<0.05, versus control, # P<0.05, versus Hcy-treated cells; data analyzed from four independent experiments (n=4).
