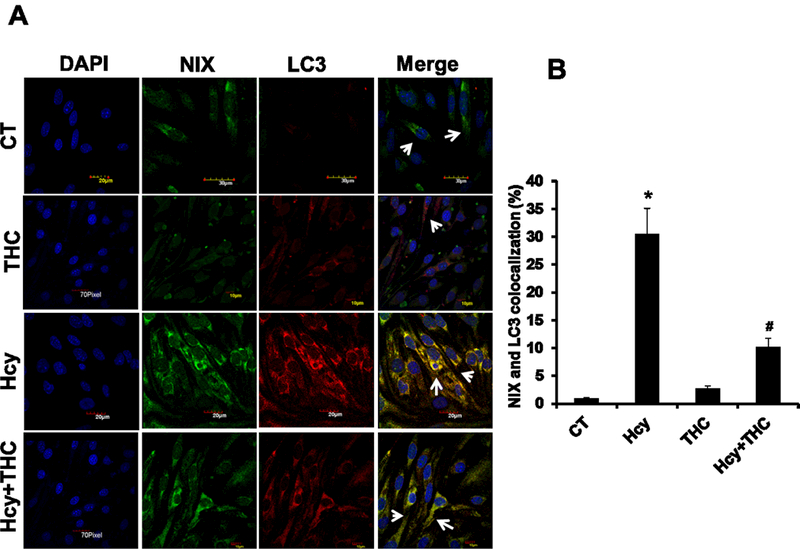
Figure. 5.

Effect of THC on Hcy induced NIX recruitment of LC3 to stressed mitochondria. 5A. Confocal images representing immune co-localization of LC3 (red color; third panel) and NIX (green color; second panel) in different bEnd3 cells treatment groups. Nuclei were stained with DAPI (left most image panels) and the merged images are illustrated at right most panel. 5B. The number of mitochondria co-localized with both mitochondria receptor NIX and autophagy marker LC3 were quantified in bEnd3 cells. All images were taken at 60X magnification. Data represents mean ± SEM. *P<0.05, versus control, # P<0.05, versus Hcy-treated cells; data analyzed from four independent experiments (n=4).
