Figure. 8.

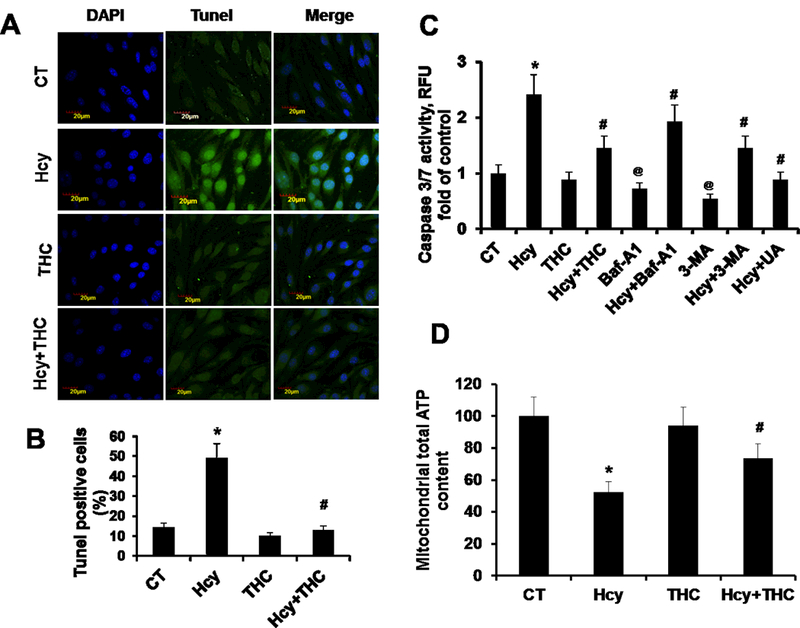
THC inhibits Hcy-induced apoptosis and mitochondrial dysfunction. 8A. For the TUNEL method, bEnd3 cells were grown in a 8-well assay plate. The cells were treated with or without THC in presence of Hcy stimulation for 24 hrs. The cells with green fluorescence represent apoptotic cells. 8B. Graph represents TUNEL assay results obtained from three independent experiments. 8C. Caspase-Glo® 3/7 Assay activity, bEnd3 cells were grown in a 96-well assay plate. The cells were analyzed for Caspase 3/7 Assay activity as described in Materials and Methods. 8C. Mitochondrial dysfunction by measurement of ATP generated following different groups of treatment. Data represents mean ± SEM. *P<0.05, versus control, #P<0.05, versus Hcy-treated cells, @P<0.05, versus control; data analyzed from four independent experiments (n=3).
